SLUAAL7 September 2022 BQ35100
6 EOS Data Example
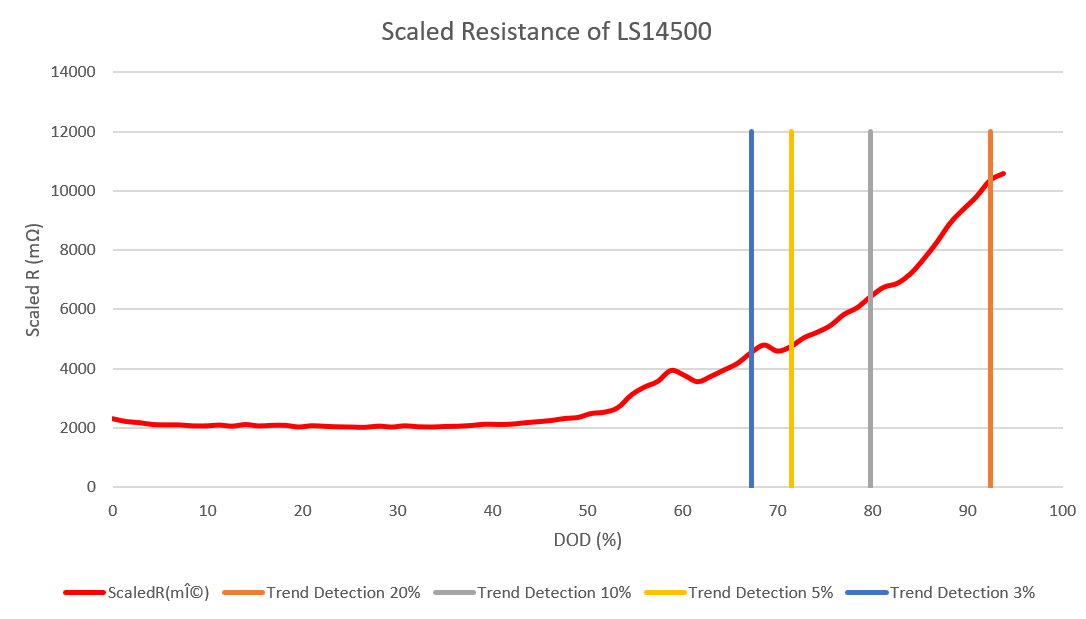
Figure 6-1 shows an example of the impedance data that is collected by the gauge. This data shows a lithium thionyl battery starting at full capacity to be completely discharged. Towards the end of the battery’s life, there is a spike in the impedance which is characteristic of lithium thionyl chloride batteries and a strong indicator that the battery is nearing the end of battery life.
For testing purposes, the battery was discharged by 1% SOH at the maximum continuous discharge rate specified by the battery manufacturer after each learning pulse. After the 1% SOH discharge the battery was relaxed for 5 hours. Each learning pulse was 500 ms long and the current was set to 100 mA to meet the requirements of the pulse length and amplitude.
 Figure 6-1 Scaled Resistance Profile of
LS14500 Battery with EOS Flag Thresholds