SLUAAX1 July 2024 UCC24624
4 Simulation Verification
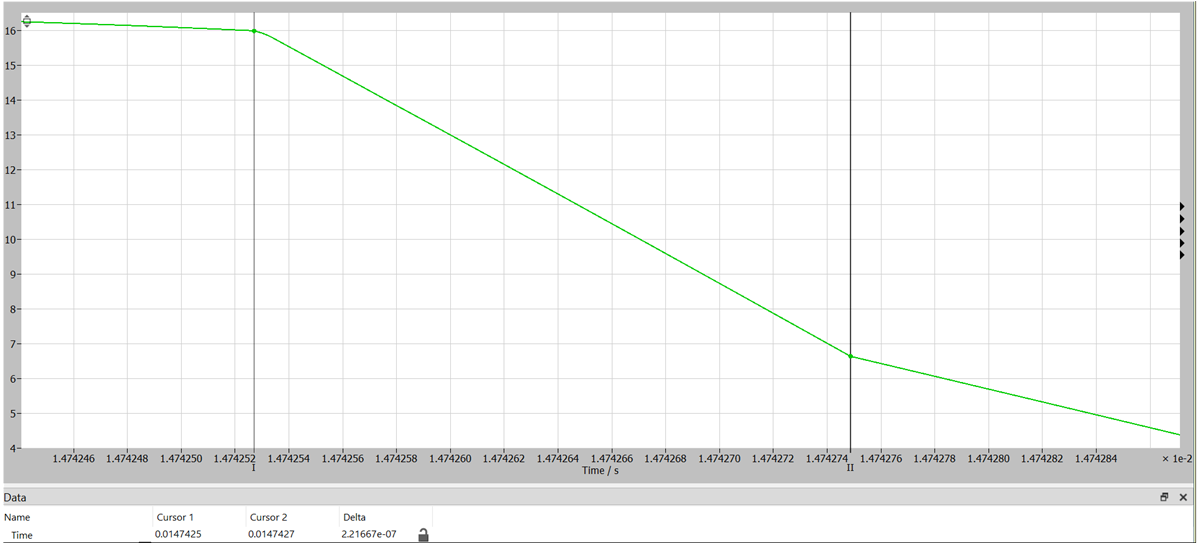
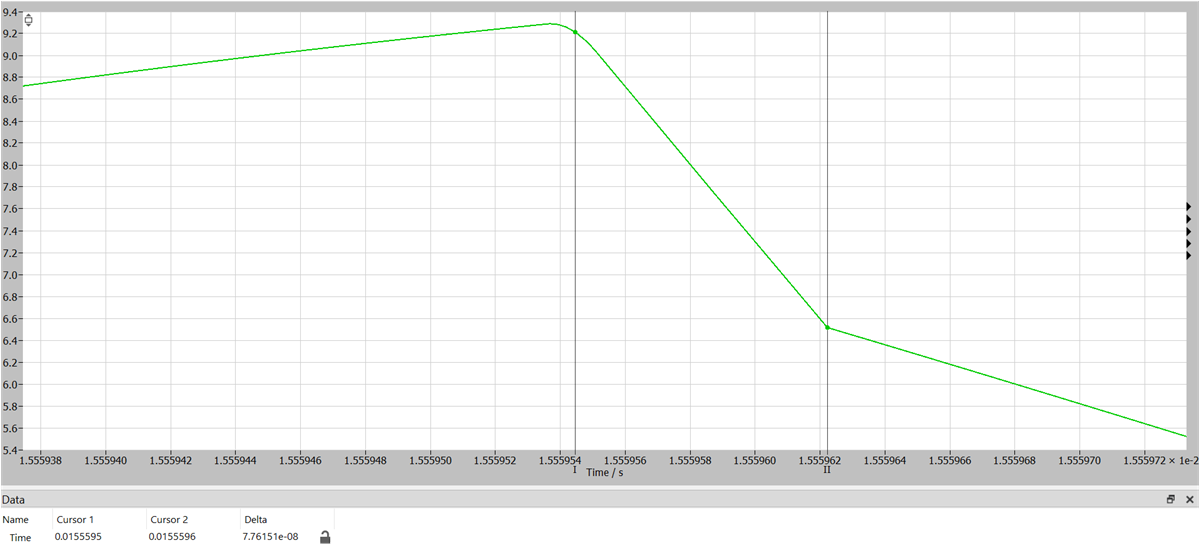
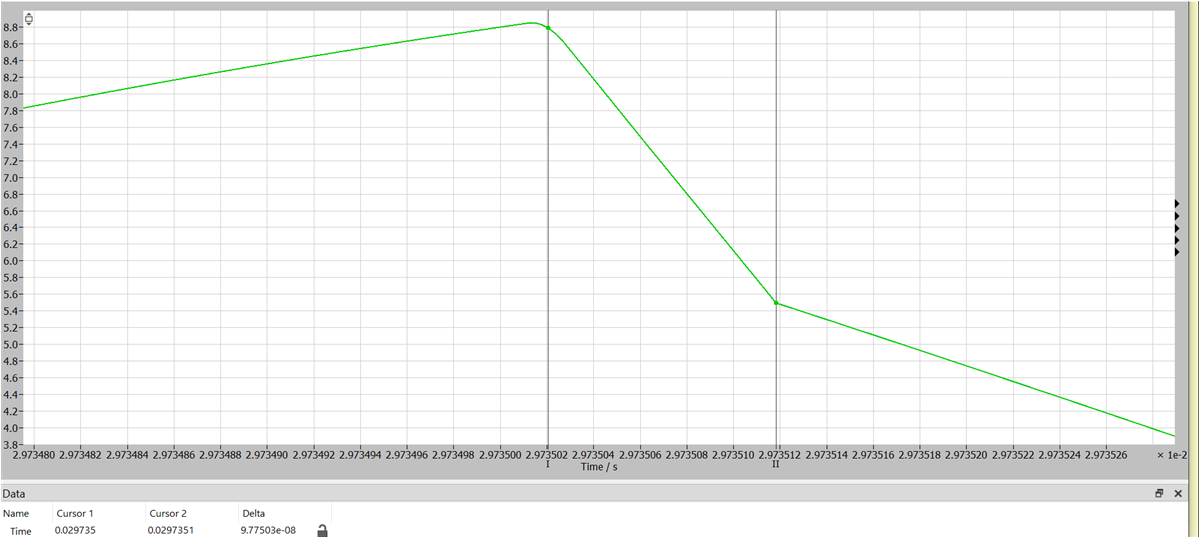
To verify the accuracy of the calculation results, Table 4-1 shows three sets of parameters in the simulation to observe the actual length of time, as shown in Figure 4-1, Figure 4-2, and Figure 4-3.
|
Vin |
400V |
400V |
400V |
|
Vo |
40V |
42V |
40V |
|
fs / fr |
212khz/170khz |
235khz/170khz |
265khz/170khz |
|
Lr / Lm |
10uH/56uH |
10uH/56uH |
10uH/56uH |
|
(simulated/calculated) |
2.22e-7/2.25e-7s |
7.76e-8s/7.79e-8s |
9.77e-8s/9.81e-8s |
 Figure 4-1 The Waveform of the First Set
of Parameters
 Figure 4-2 The Waveform of the Second Set
of Parameters
 Figure 4-3 The Waveform of the Third Set
of Parameters
Figure 4-3 The Waveform of the Third Set
of ParametersThe calculations from the simulation result are relatively accurate, meaning you can set up a delay based on these calculated results.
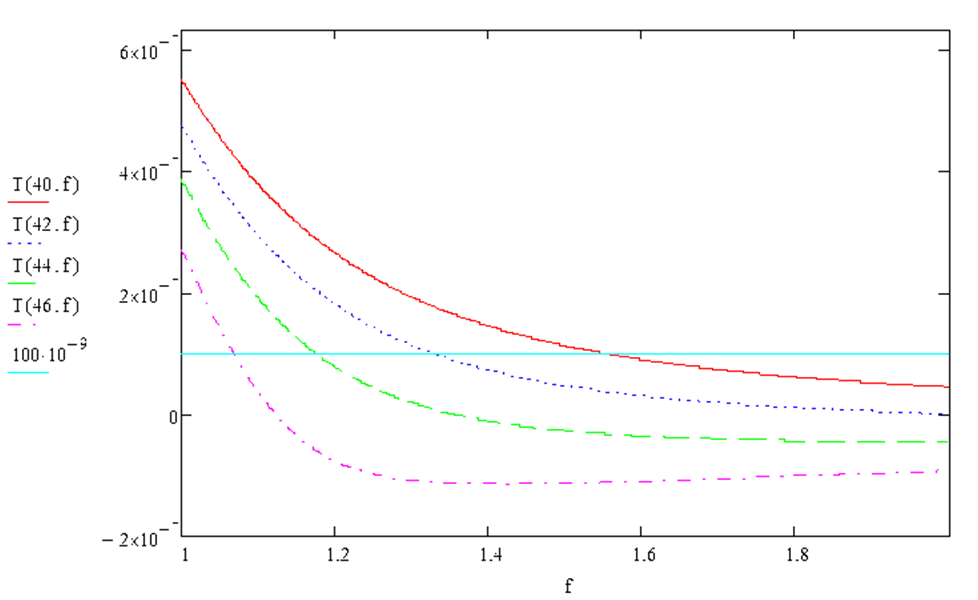
If the dead time is set to 100ns, then set a delay for the SR start-up time when α1 is greater than 100ns, where delay time is α1 minus the dead time. Figure 4-4 shows time curves α1 for different output voltages and loads, which shows that the worst case occurs in the case of the lowest output voltage, the heaviest load.
 Figure 4-4 Time Curves For Different
Output Voltages and Frequency