SLUUBU0A June 2018 – July 2022 BQ27Z561
- BQ27Z561EVM-011 EVM Single-Cell Impedance Track™ Technology
- Trademarks
- 1Features
- 2BQ27Z561-Based Circuit Module
- 3Circuit Module Physical Layout, Bill of Materials and Schematic
- 4EVM Hardware and Software Setup
- 5Troubleshooting Unexpected Dialog Boxes
- 6Hardware Connection
- 7Operation
- 8Related Documentation from Texas Instruments
- 9Revision History
7.1 Starting the Program
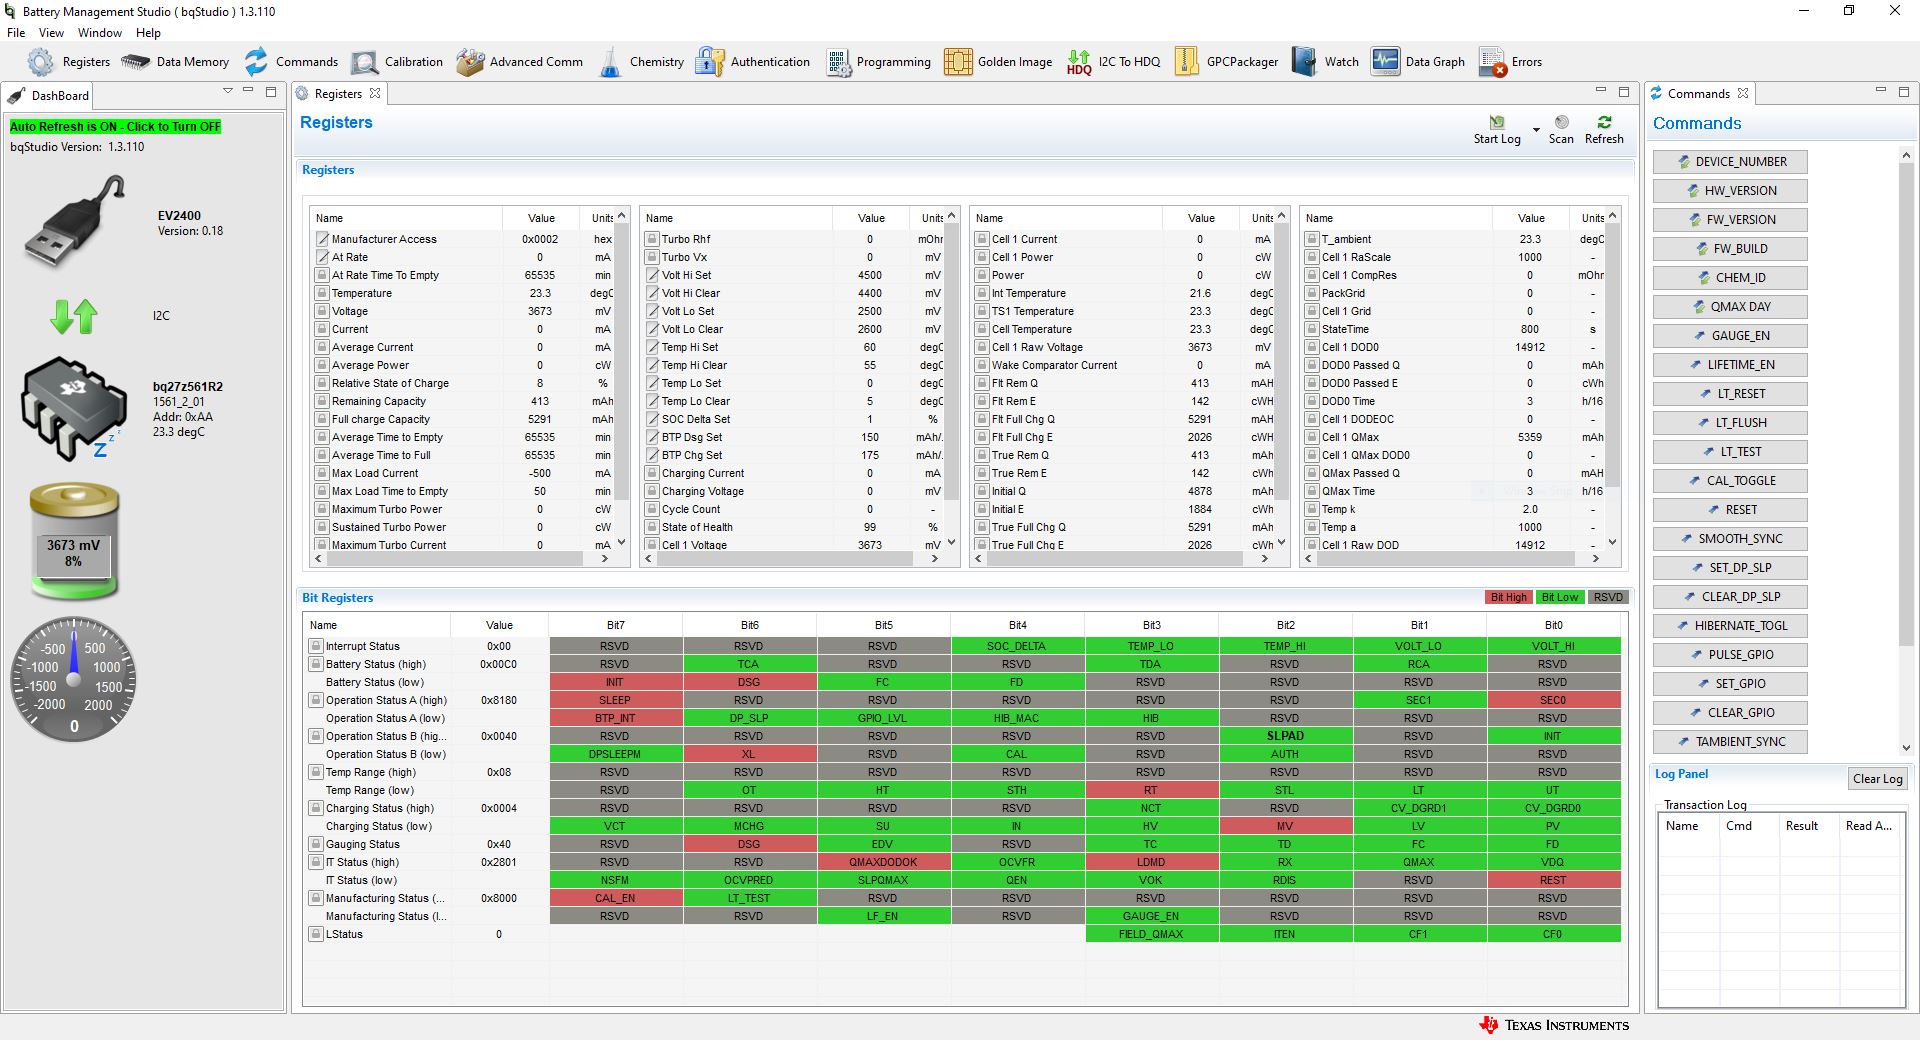
Run bqStudio from the desktop. The window consists of a tools panel at the top, and other linked windows that can be hidden, docked in various positions, or allowed to float as separate windows. When bqStudio first starts up the Gauge Dashboard window, the Registers window,and Data Memory window should be seen in the main window. Registers, Data Memory, Commands, and other windows can be added to the main window by clicking on the corresponding icon in the tools panel at the top of the main window. Data should appear initially in the Gauge Dashboard, Registers and Data Memory sections. The Refresh (single time scan) or the Scan (continuous scan) buttons can be clicked in order to update the data in the Registers and Data Memory windows. The continuous scan is enabled when the Scan checkbox is highlighted green and disabled when the Scan checkbox is not highlighted. The continuous scanning interval can be set with the stopwatch icon next to the Scan button. When the stopwatch icon is clicked, a drop-down menu appears and the desired scanning interval can be selected. The scan interval value show up next to the stopwatch icon.
bqStudio provides a logging function which logs selected Data Registers last received from the BQ27Z561. To enable this function, click the Start Log. The default elapsed interval is 4000 milliseconds. To change this interval, go to Window, select Preferences, choose Registers, and change Scan/Log Interval from 4000 to 1000 milliseconds. There is no need to log faster than 1 second as the gas gauge does not update the registers faster than 1 second.
 Figure 7-1 Registers Screen
Figure 7-1 shows the main bqStudio window. Additional Flag and Control Status data can be viewed at the bottom of the registers window.