SLVAEX3 October 2020 TPS8802 , TPS8804
4.3.1 Varying Amplifier Speeds
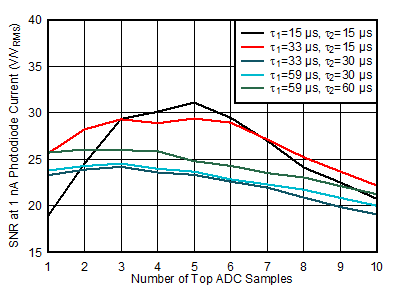
Figure 4-11 shows the SNR at 1 nA with varying time constants and optimized average filter. Using one signal ADC sample, τ1=59 μs and τ2=60 μs has the best SNR at 25.7, a 36% increase over τ1=15 μs and τ2=15 μs at 18.9. This result shows the benefit of optimizing the amplifier time constants. When multiple samples are averaged, the SNR improves further. Averaging 5 samples 20 μs apart starting at 48 μs after the LED is enabled brings the SNR at 1 nA up to 31.1 when τ1=15 μs and τ2=15 μs.

| tLED=100 µs | tSAMP=20 µs |

| tLED=100 µs | tSAMP=20 µs |