SLVAEX3 October   2020 TPS8802 , TPS8804


  1.   Trademarks
  2. 1Introduction
  3. 2SNR Optimization
    1. 2.1 SNR Overview
    2. 2.2 Smoke Concentration Measurement
    3. 2.3 Amplifier and LED Settings
      1. 2.3.1 Photo Amplifier Gain
      2. 2.3.2 Photo Amplifier and AMUX Speed
      3. 2.3.3 LED Current and Pulse Width
    4. 2.4 ADC Sampling and Digital Filtering
      1. 2.4.1 ADC Sampling
      2. 2.4.2 Digital Filtering
  4. 3System Modeling
    1. 3.1 Impulse Response
      1. 3.1.1 Photodiode Input Amplifier Model
      2. 3.1.2 Photodiode Gain Amplifier and AMUX Buffer Model
      3. 3.1.3 Combined Signal Chain
    2. 3.2 Noise Modeling
      1. 3.2.1 Noise Sources
      2. 3.2.2 Output Voltage Noise Model
      3. 3.2.3 ADC Quantization Noise
    3. 3.3 SNR Calculation
      1. 3.3.1 Single ADC Sample
      2. 3.3.2 Two ADC Samples
      3. 3.3.3 Multiple Base ADC Samples
      4. 3.3.4 Multiple Top ADC Samples
      5. 3.3.5 Multiple ADC Sample Simulation
  5. 4SNR Measurements
    1. 4.1 Measurement Procedure
    2. 4.2 Measurement Processing
    3. 4.3 Measurement Results
      1. 4.3.1 Varying Amplifier Speeds
      2. 4.3.2 Varying Digital Filter and ADC Timing
      3. 4.3.3 Varying LED Pulse Length
      4. 4.3.4 Varying ADC Sample Rate
      5. 4.3.5 Real and Ideal System Conditions
      6. 4.3.6 Number of Base Samples
      7. 4.3.7 ADC Resolution
  6. 5Summary
  7. 6References

Varying Digital Filter and ADC Timing

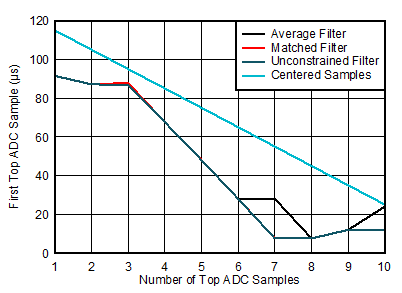
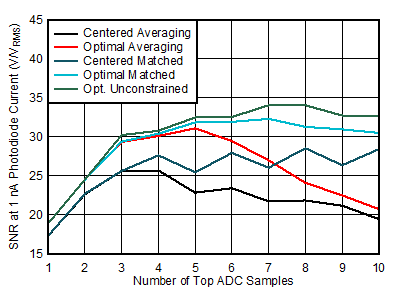
Optimizing the filter by changing the timing of the samples further improves the SNR. Using τ1=15 μs and τ2=15 μs, the SNR at 1 nA for averaging 5 samples improves from 22.8 to 31.1 by taking the first ADC sample at 48 μs instead of 75 μs. The optimized matched filter with 7 ADC samples has an SNR/nA of 32.3. The unconstrained filter has the best SNR of the three filter types, 34.0, achieved with 7 and 8 ADC samples.
GUID-20200930-CA0I-KS2N-BNN1-XVZTRDBHMMWC-low.gif

tLED=100 µs tSAMP=20 µs τ1=15 µs τ2=15 µs

Figure 4-13 SNR at 1 nA with Varying Digital Filter and ADC Timing
GUID-20200930-CA0I-9NWK-RBCP-CSDMVZFNLLVL-low.gif

tLED=100 µs tSAMP=20 µs τ1=15 µs τ2=15 µs

Figure 4-14 Optimal First Signal Sample for Each Digital Filter