SLVAFS9 August 2024 DRV8316 , DRV8317
3.4 PCB Design
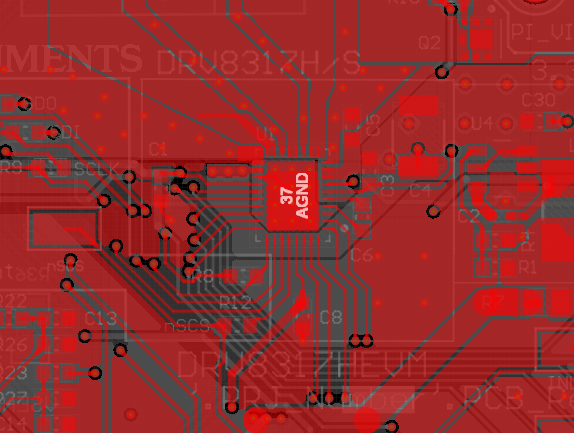
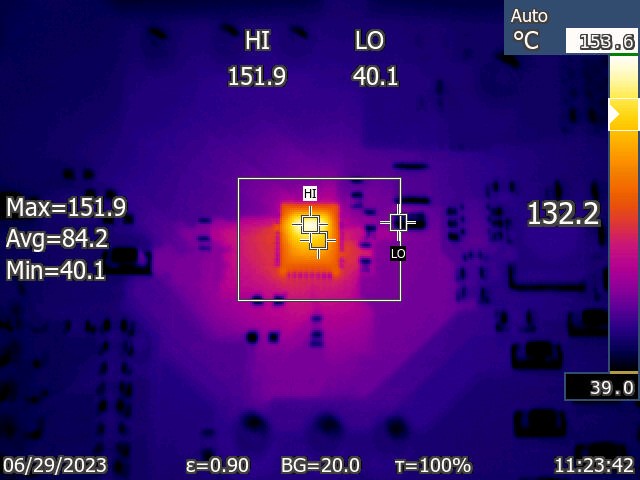
Images captured during this testing also show how heat dissipated across the PCB during device operation. As seen in the figures below, the part of the device package closest to the motor outputs (at the top of the package) was the hottest, which corresponds with the internal drain-to-source resistance of the phase half-bridge MOSFETs. Additionally, from the images observe the thermal gradient across the device package and the PCB. The largest gradient occurs between the device and the board. This is because the thermal pad on the bottom of the device is the primary route for thermal dissipation. As a result, TI recommends that thermally efficient board designs maximize the copper area connected to the thermal ground pad of the device. Although the thermal camera only reveals the heat dissipation on the surface of the board, the image shows the importance of effective PCB design for thermal performance. When comparing the thermal images with the layout design shown in the figure below, after the device package, the next area of the board with the highest temperature is to the bottom and to the left of the device. This region corresponds with most of the traces going from the driver to the rest of the circuit. These traces are very thin and are not surrounded by copper, which means there is not much area for heat to dissipate from the driver into the board and from the board into the environment. Meanwhile, the coolest areas of the board are to the top and right of the device package. These regions correspond with the phase outputs, VM supply, and ground, all of which consist of large copper planes. These planes allow heat to dissipate quickly across a large area.
Since most heat dissipates through the ground planes, note the importance of having a large, unimpeded area of ground copper on all layers directly under the device package. Traces reduce the area over which the heat can flow. This can be seen in the thermal images where heat builds up over the area with traces rather than flowing into the cooler copper planes. Thus, this data shows the effectiveness of large copper planes in action, as shown in Figure 3-3.
 Figure 3-3 DRV8317HEVM Layout
 Figure 3-4 Thermal Image of DRV8317 at 50kHz PWM Frequency and
2.99A RMS