SLVSDR3C may 2018 – may 2023 ADC12DL3200
PRODUCTION DATA
- 1
- 1Features
- 2Applications
- 3Description
- 4Revision History
- 5Pin Configuration and Functions
-
6Specifications
- 6.1 Absolute Maximum Ratings
- 6.2 ESD Ratings
- 6.3 Recommended Operating Conditions
- 6.4 Thermal Information
- 6.5 Electrical Characteristics: DC Specifications
- 6.6 Electrical Characteristics: Power Consumption
- 6.7 Electrical Characteristics: AC Specifications (Dual-Channel Mode)
- 6.8 Electrical Characteristics: AC Specifications (Single-Channel Mode)
- 6.9 Timing Requirements
- 6.10 Switching Characteristics
- 6.11 Typical Characteristics
-
7Detailed Description
- 7.1 Overview
- 7.2 Functional Block Diagram
- 7.3
Feature Description
- 7.3.1 Analog Inputs
- 7.3.2 ADC Core
- 7.3.3 Timestamp
- 7.3.4 Clocking
- 7.3.5 LVDS Digital Interface
- 7.3.6 Alarm Monitoring
- 7.3.7 Temperature Monitoring Diode
- 7.3.8 Analog Reference Voltage
- 7.4
Device Functional Modes
- 7.4.1 Dual-Channel Mode (Non-DES Mode)
- 7.4.2 Internal Dither Modes
- 7.4.3 Single-Channel Mode (DES Mode)
- 7.4.4 LVDS Output Driver Modes
- 7.4.5 LVDS Output Modes
- 7.4.6 Power-Down Modes
- 7.4.7 Calibration Modes and Trimming
- 7.4.8 Offset Calibration
- 7.4.9 Trimming
- 7.5 Programming
- 7.6 Register Maps
- Application and Implementation
- 8Device and Documentation Support
- 9Mechanical, Packaging, and Orderable Information
8.2.2.2 Application Curves
The following application curves demonstrate performance and results only of the ADC. The amplifier front-end is not included in these measurements. Figure 8-5 to Figure 8-11 illustrate the following configurations and measurements:
- 12-bit, 5-GSPS, single-channel oscilloscope
- Idle-channel noise (no input)
- 40-MHz, square-wave time domain
- 200-MHz, sine-wave time domain
- 200-MHz, sine-wave frequency domain (FFT)
- 12-bit, 2.5-GSPS, dual-channel oscilloscope
- Idle-channel noise (no input)
- 40-MHz, square-wave (channel B) and 200-MHz, sine-wave (channel A) time domain
- 40-MHz, square-wave (channel B) time domain and 200-MHz, sine-wave (channel A) frequency domain (FFT)
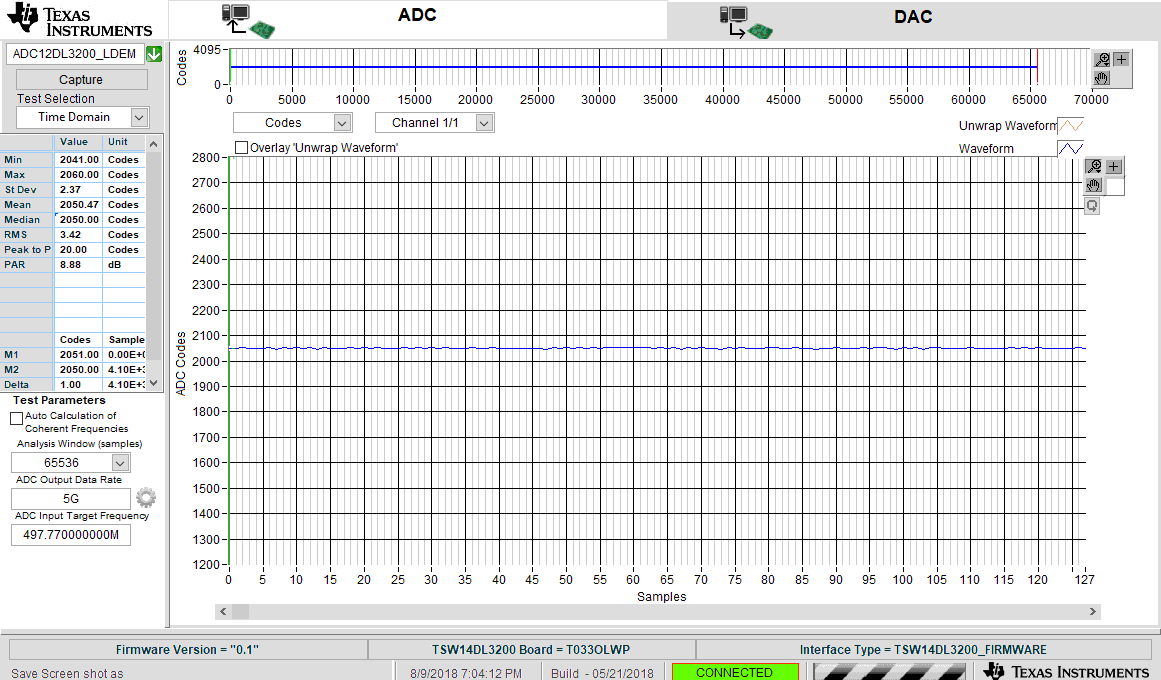 Figure 8-5 Idle-Channel Noise (No Input) for 5-GSPS, Single-Channel Oscilloscope
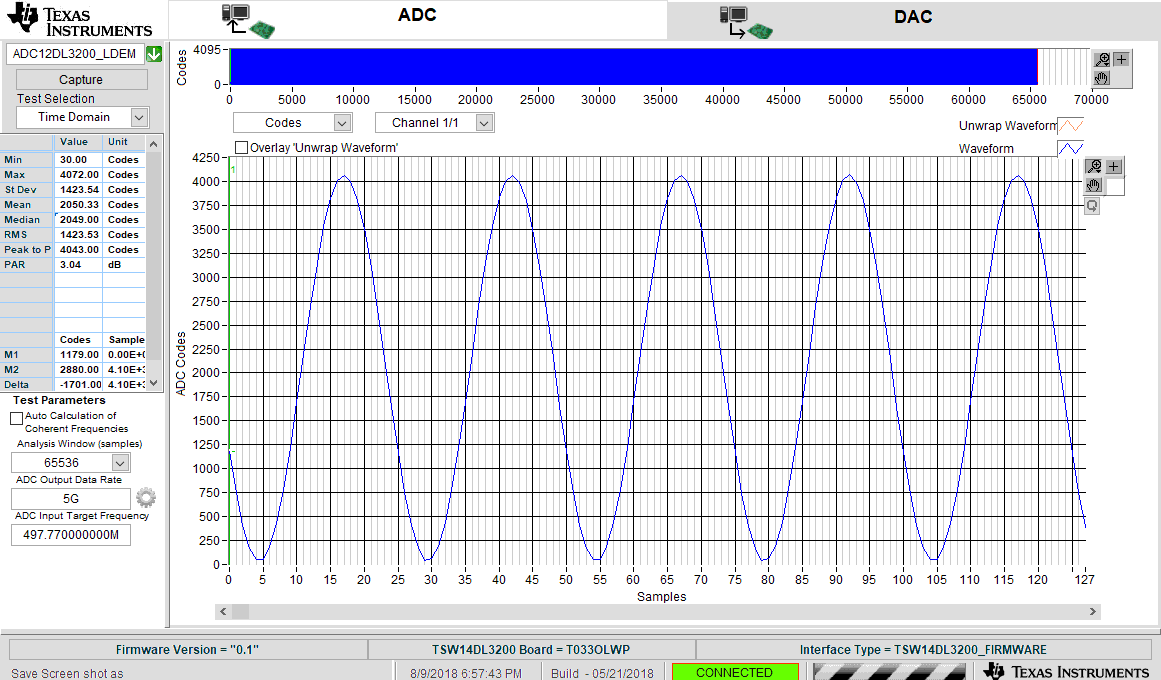 Figure 8-7 200-MHz, Sine-Wave Time Domain for 5-GSPS, Single-Channel Oscilloscope
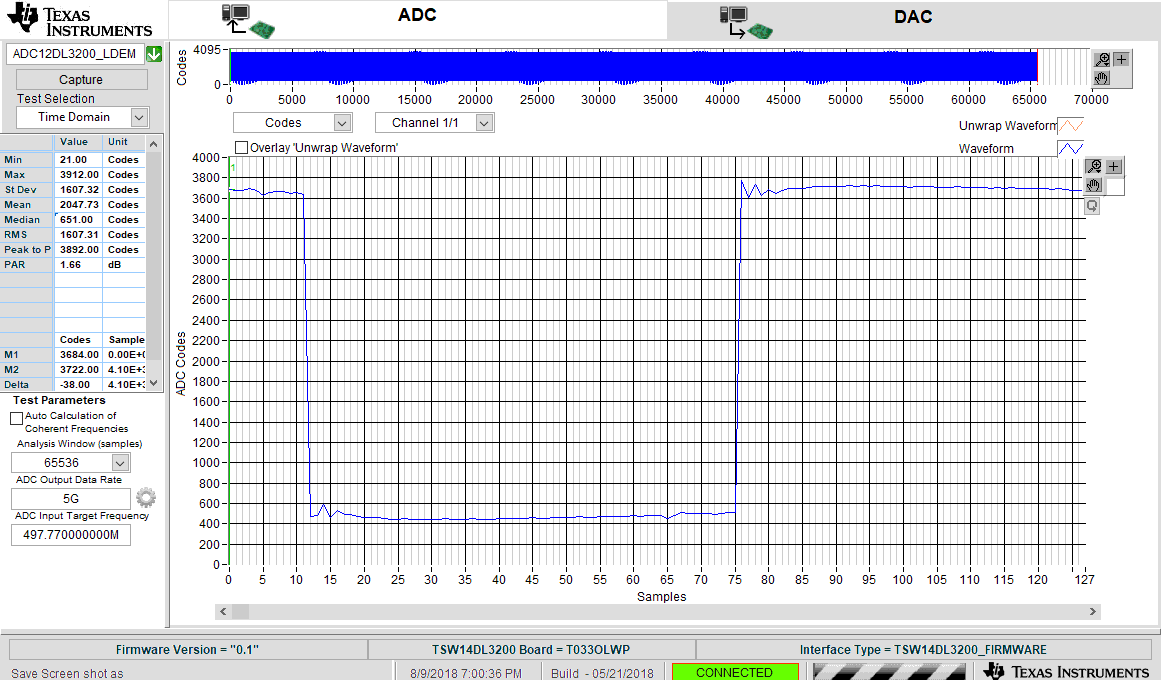 Figure 8-6 40-MHz, Square-Wave Time Domain for 5-GSPS, Single-Channel Oscilloscope
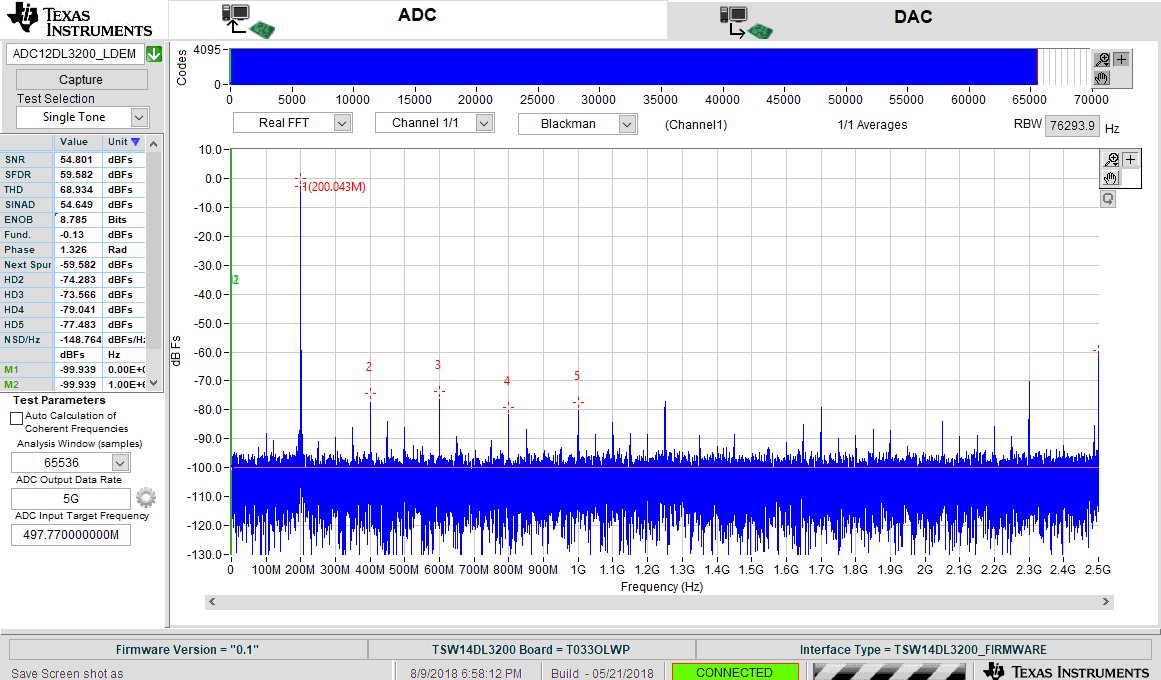 Figure 8-8 200-MHz, Sine-Wave Frequency Domain (FFT) for 5-GSPS, Single-Channel Oscilloscope
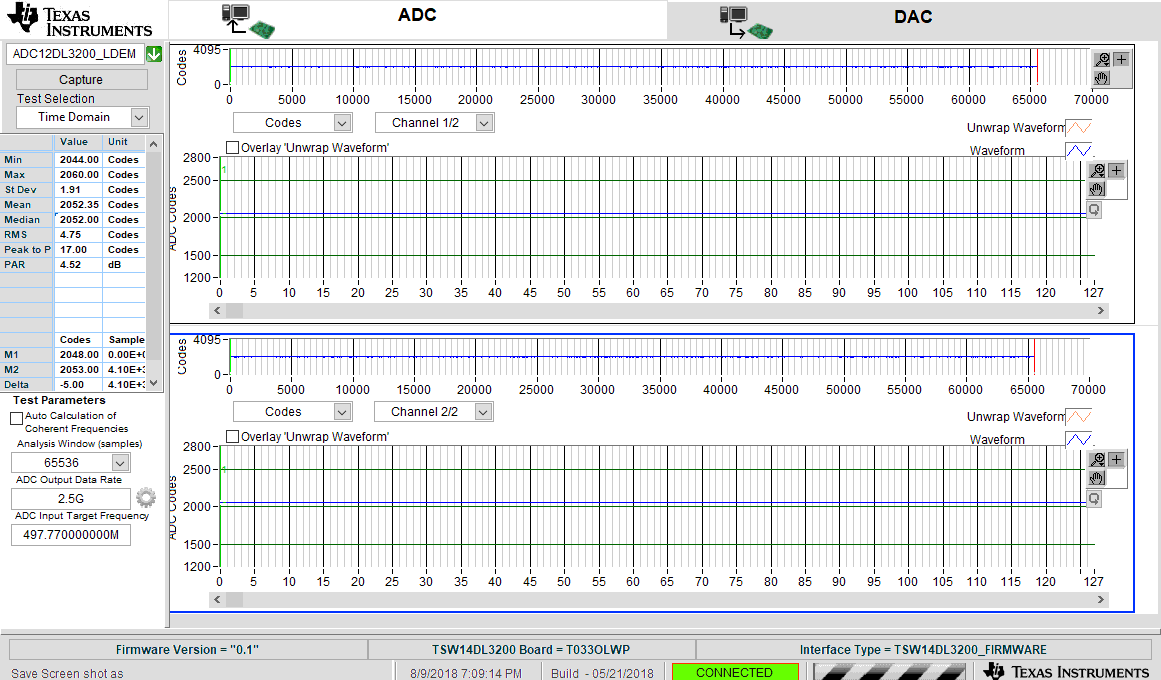 Figure 8-9 Idle-Channel Noise (No Input) for 2.5-GSPS, Dual-Channel Oscilloscope
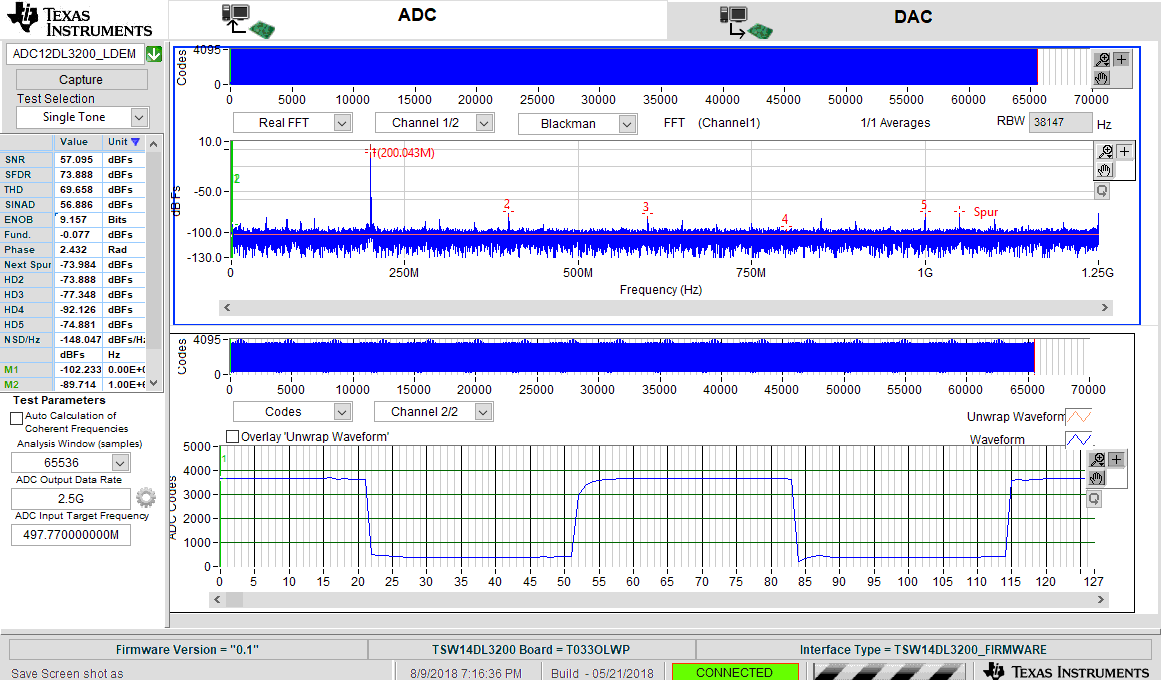 Figure 8-11 200-MHz, Sine-Wave (Channel A) Frequency Domain (FFT) and 40-MHz, Square-Wave (Channel B) Time Domain for 5-GSPS, Single-Channel Oscilloscope
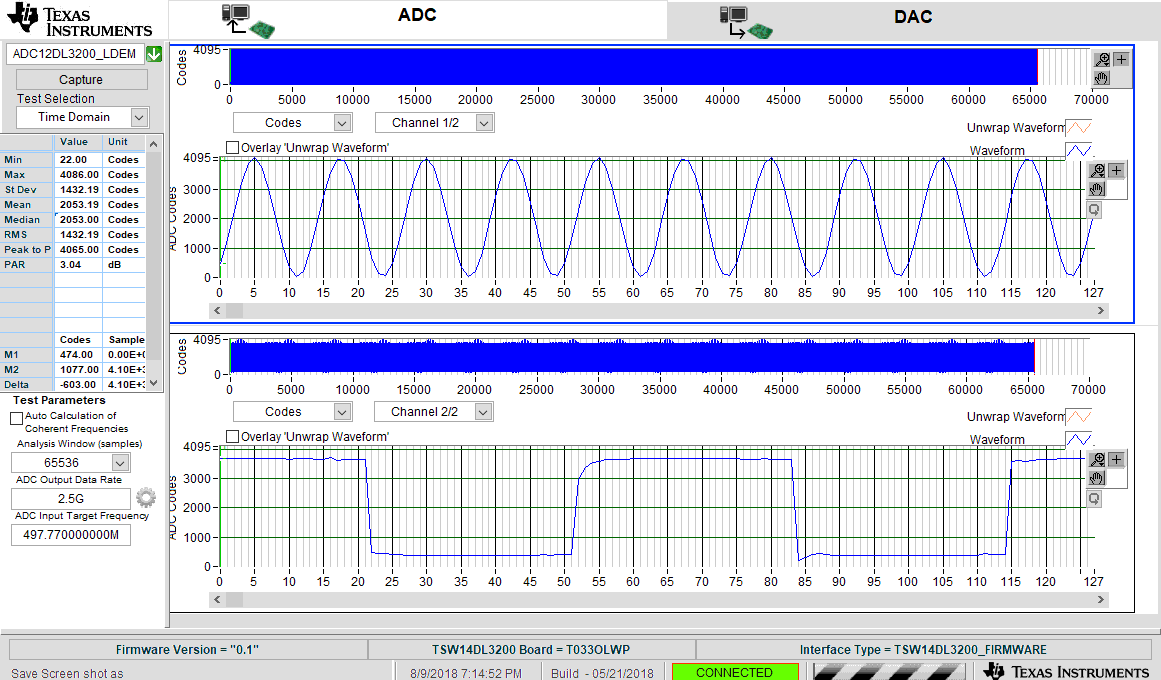 Figure 8-10 200-MHz, Sine-Wave (Channel A) and 40-MHz, Square-Wave (Channel B) Time Domain for 5-GSPS, Single-Channel Oscilloscope