SLVUAT2A November 2016 – February 2022 TPSM84A21 , TPSM84A22
5 Performance Data
The graphs and waveforms in Figure 5-1 to Figure 5-6 demonstrate the performance of the TPSM84A22EVM.
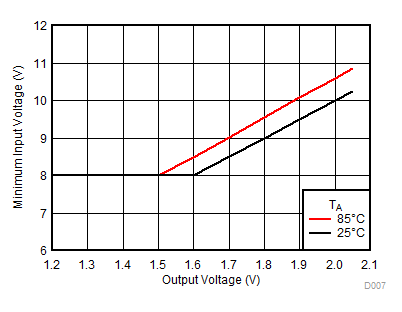 Figure 5-1 TPSM84A22EVM Efficiency (VG = OPEN)
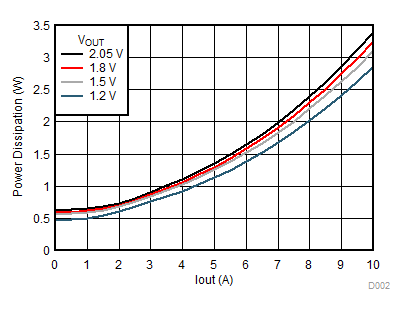 Figure 5-3 TPSM84A22EVM Power Dissipation
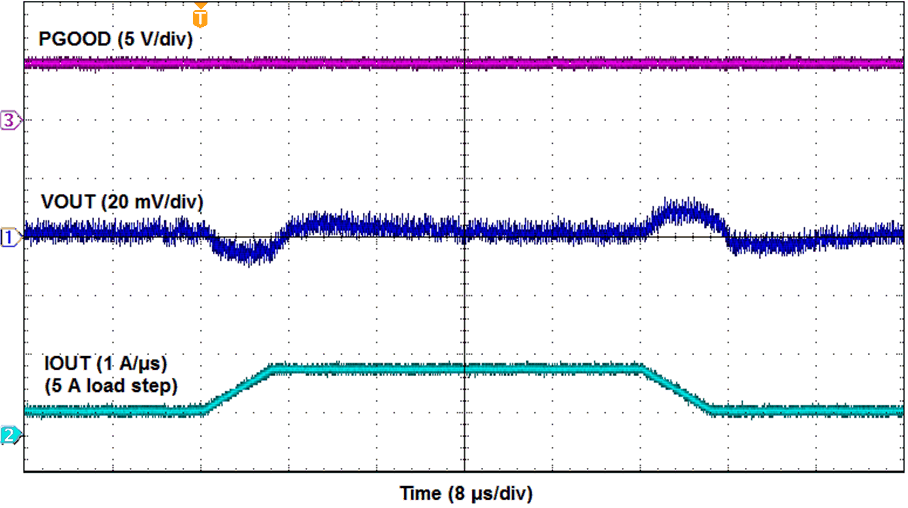
| VIN = 12 V | VOUT = 1.2 V | Load Step = 5 A |
| COUT = 0 µF | Slew Rate = 1 A/µs |
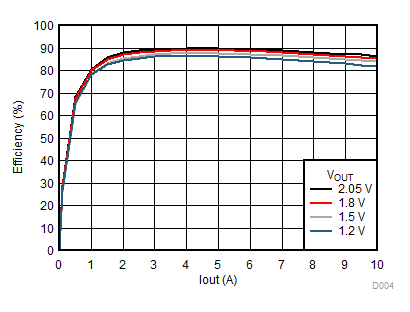 Figure 5-2 TPSM84A22EVM Efficiency (VG = 5 V)
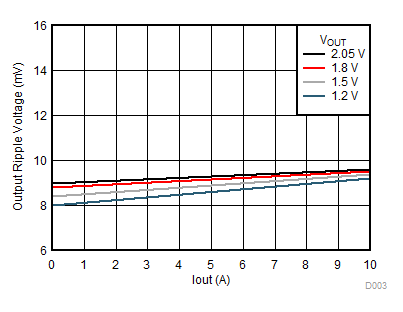 Figure 5-4 TPSM84A22EVM Output Voltage Ripple
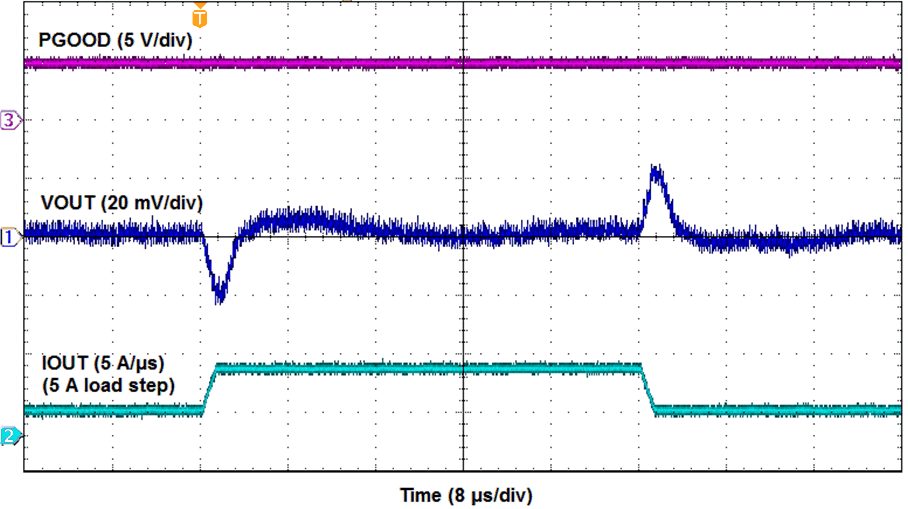
| VIN = 12 V | VOUT = 1.2 V | Load Step = 5 A |
| COUT = 0 µF | Slew Rate = 5 A/µs |