SLVUBT1A October 2019 – June 2020 TPS50601A-SP
4.2.2 Analyzing Frequency Response with Histogram
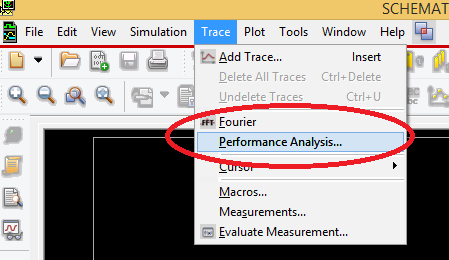
- Select Trace → Performance Analysis. A pop-up will appear. Click “OK”.
- Right click on the plot area and click "Add Trace".
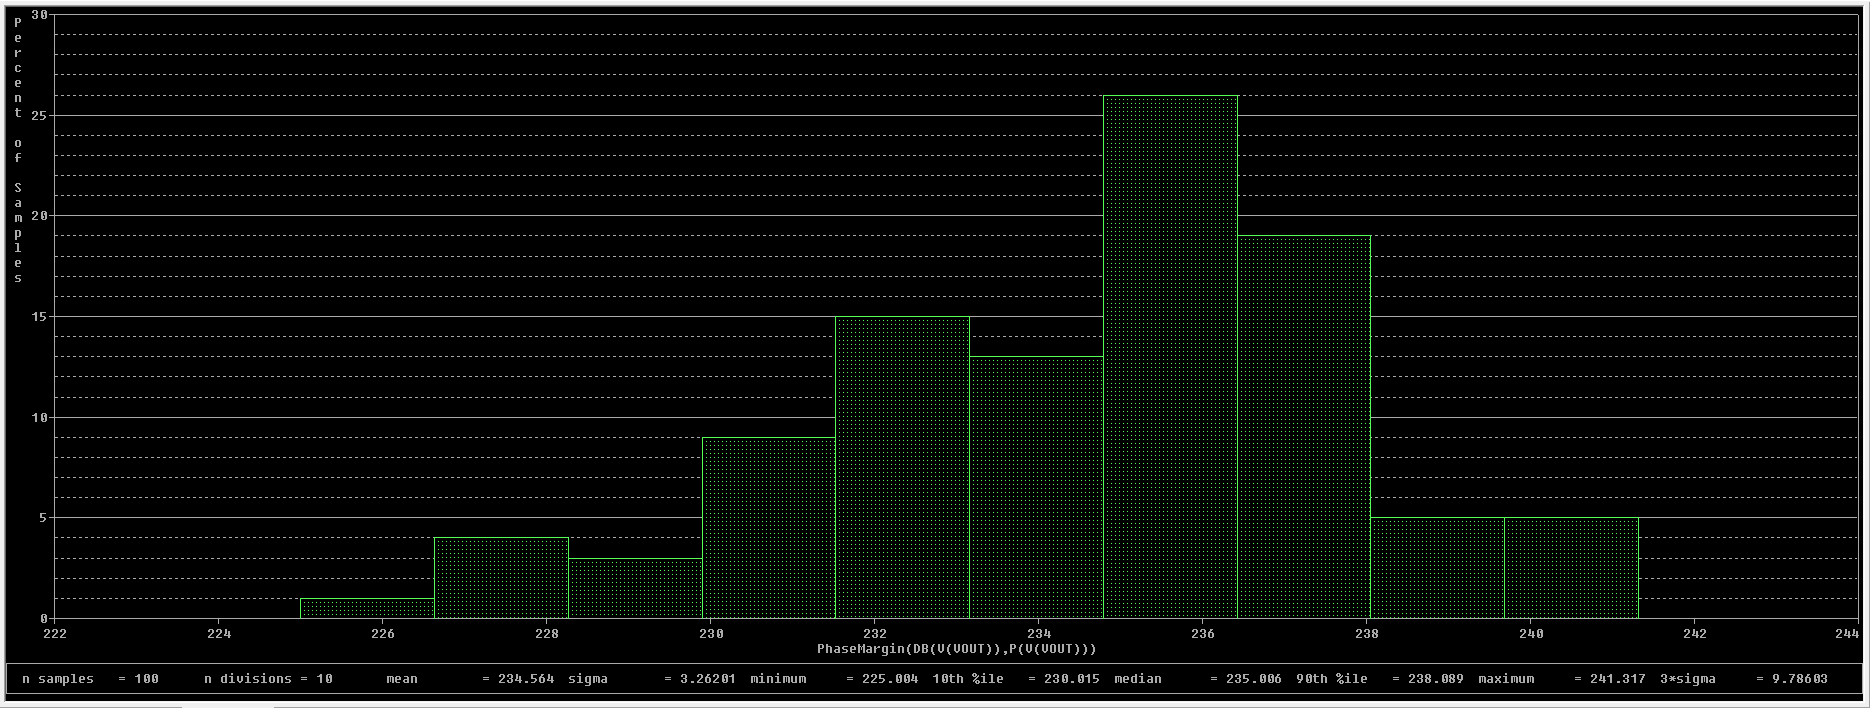
- Copy the expression PhaseMargin(DB(v(vout)),P(v(vout))) into the Trace Expression field and click "OK". The histogram will be displayed in the trace window.

 Figure 4. Frequency Response Histogram