SLVUCD1A May 2022 – September 2024 TPS65219 , TPS65219-Q1
- 1
- Abstract
- Trademarks
- 1Caution
- 2Introduction
- 3Requirements
- 4TPS65219 Resources Overview
- 5EVM Configuration
- 6Graphical User Interface (GUI)
- 7Schematics, PCB Layouts, and Bill of Materials
- 8Revision History
6.5 Sequence Configuration
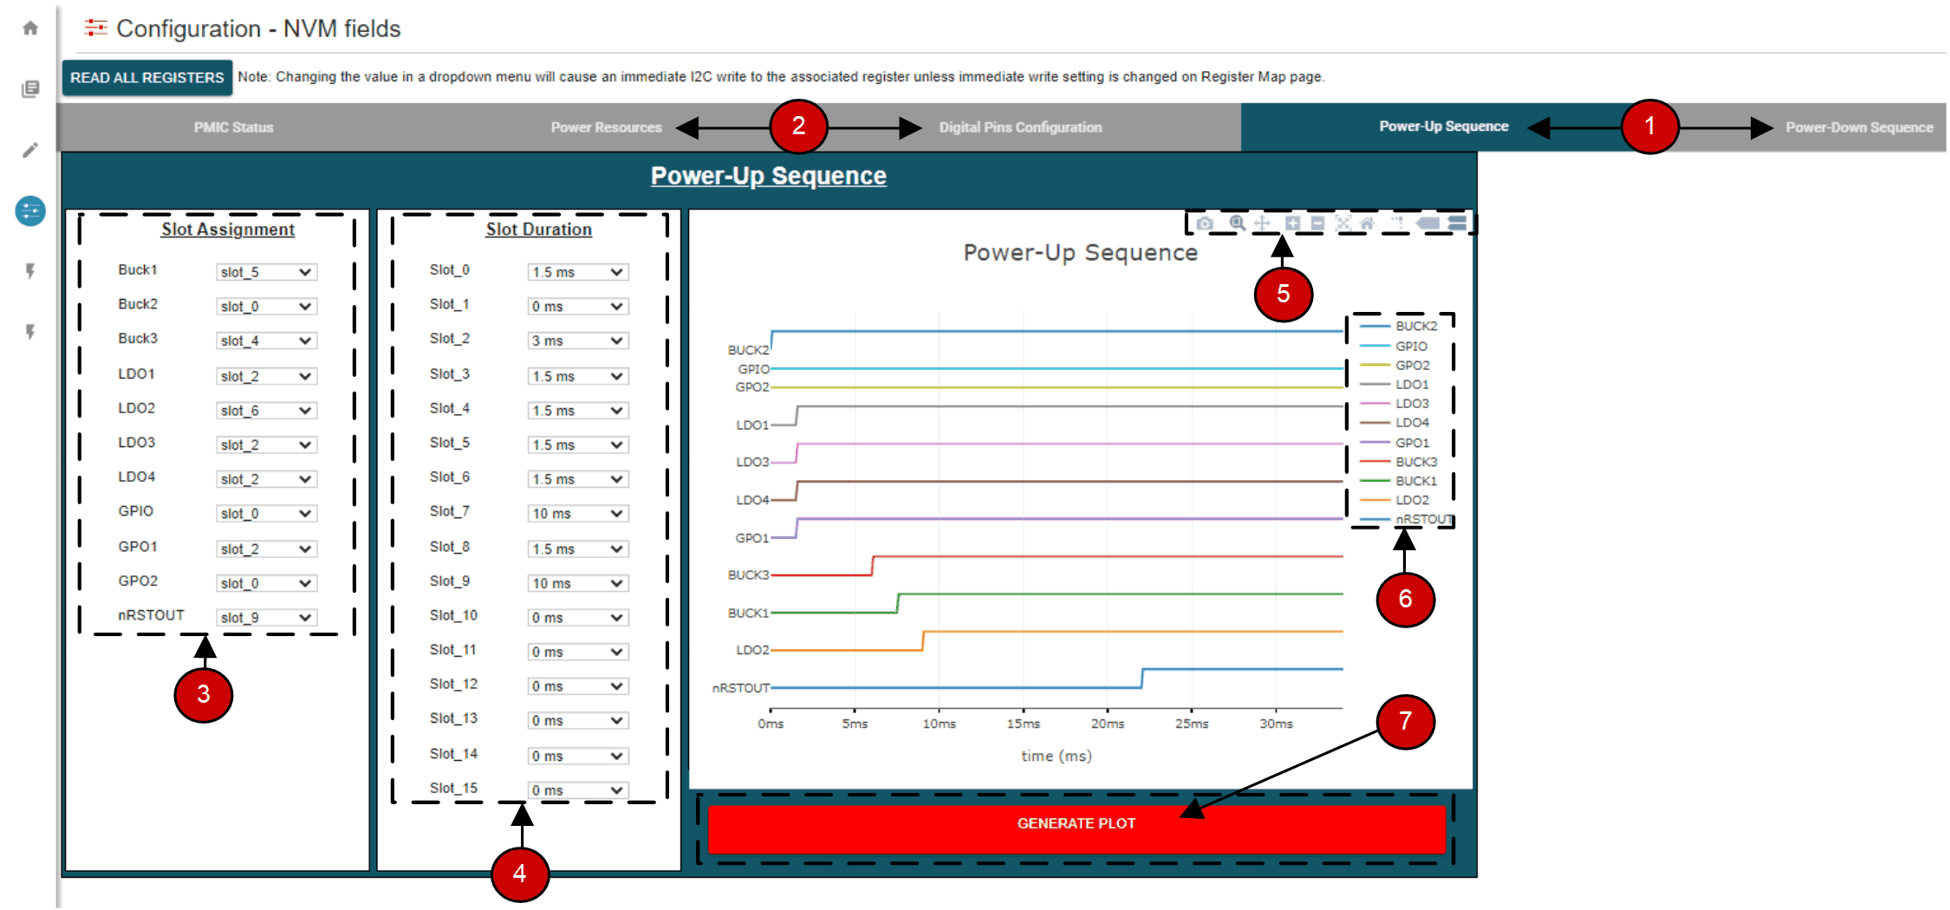
The TPS65219 GUI features sequence configuration tabs for modifying and plotting the power-up and power-down sequences. The power-up sequence and power-down sequence tabs plot the voltage level of each signal as a function of time based on the corresponding settings.
Plotting Features
The features of the sequence configuration tabs is demonstrated in Figure 6-11.
 Figure 6-11 Sequence Plotting Tool
Note: Graph rise and fall time durations
are not accurate. The actual rise and fall times dependent on load capacitance and
other variables.
- Power-up sequence and power-down sequence plotting tabs.
- Rails disabled in active state always remain low when plotted. Configure these settings in the "Power Resources or Digital Pins Configuration tab.
- Slot Assignment: The TPS65219 has 16 possible slot assignments (Slot 0 to Slot 15) which can be assigned to each rail for flexible power sequences.
- Slot Duration: The TPS65219 has four possible slot durations (0ms, 1.5ms, 3ms, 10ms) which can be assigned to each slot for flexible power sequences.
- Plot menu bar appears upon hovering over graph. This feature is explained in Menu bar Options
- Click on a signal in the legend to change the visibility.
- Plot the design by pressing the Generate Plot button. Signal order is sorted based on which signals rise or fall first
Menu bar Options
The plot menu bar has several settings including:
- Camera: Download Plot as PNG
- Zoom: Left click and drag the mouse on the graph to zoom into the selected area. Enabled by default.
- Pan: Left click and drag the mouse to navigate the plot.
- Zoom In
- Zoom Out
- Auto-Scale Graph
- Reset Axis
- Toggle Like Spikes
- Show Closest Data on Hover
- Compare Data on Hover. Enabled by default.