SLWU087E november 2013 – june 2023
- 1
- High Speed Data Converter Pro GUI
- Trademarks
- 1 Introduction
- 2 Software Start up
-
3 User Interface
- 3.1
Toolbar
- 3.1.1 File Options
- 3.1.2 Instrument Options
- 3.1.3 Data Capture Option
- 3.1.4
Test Options
- 3.1.4.1 Notch Frequency Bins
- 3.1.4.2 2 Channel Display and Cursor Lock
- 3.1.4.3 Analysis Window Markers
- 3.1.4.4 X-Scale in Time
- 3.1.4.5 Y-Scale in Voltage
- 3.1.4.6 Other Frequency Options
- 3.1.4.7 NSD Marker
- 3.1.4.8 Phase Plot
- 3.1.4.9 Phase in Degree
- 3.1.4.10 Histogram
- 3.1.4.11 Disable User Popups
- 3.1.4.12 HSDC Pro Lite Version
- 3.1.5 Help
- 3.2 Status Windows
- 3.3 Mode Selection
- 3.4 Device Selection
- 3.5 Skip Configuration
- 3.6 Capture Button (ADC Mode Only)
- 3.7 Test Selection (ADC Mode only)
- 3.8 DAC Display Panel (DAC Mode only)
- 3.9 I/Q Multi-Tone Generator
- 3.1
Toolbar
- 4 ADC Data Capture Software Operation
- 5 TSW1400 Pattern Generator Operation
- 6 TSW14J58 Functional Description
- 7 TSW14J57 Functional Description
- 8 TSW14J56 Functional Description
- 9 TSW14J50 Functional Description
- 10TSW14J10 Functional Description
- A Signal Processing in High Speed Data Converter Pro
- B History Notes
- C Revision History
3.7.1.1 Parameter Controls
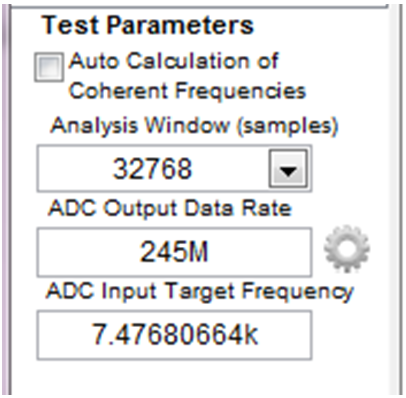
The output data rate is entered in the ADC Output Data Rate text box. In most cases this value will be the same as the sample rate of the ADC. For parts that support decimation, this value is usually lower. For example, this number is usually 2x lower if the part decimates by 2 and 4x lower if it decimates by 4. The number is entered in Hertz (Hz), although the letter M may be appended to represent the sampling rate in MHz.
For example, 125M = 125 MHz or 125,000,000 Hz.
The expected input frequency is entered in the ADC Input Target Frequency text box. If the Auto Calculation of Coherent Input Frequency mode is enabled, then this input frequency is adjusted up or down slightly away from the input frequency automatically. If coherent input frequency is required, the signal generator used to source the input frequency must be set to this exact calculated coherent frequency. The coherent frequency calculation takes the ADC sampling rate, the input frequency as entered by the user in Hertz, and the FFT record length and adjusts the input frequency so that the captured data starts and ends on the same place of the sine wave of the input frequency. This avoids an artifact of the FFT calculation from presenting a smeared power spectrum due to the fact that the FFT presumes the sample of the input is part of a continuous input signal. If the input and sampling frequency is not coherent, and the sampled data is appended end to end to form a continuous input signal, then there is an apparent phase discontinuity at the beginning and the end of the sampled data. Making the sampling and input frequencies coherent avoids this apparent discontinuity. If the input frequency cannot be made coherent, then the windowing functions other than Rectangular can be used to process out this effect to some degree.
The FFT record length can be set in the Analysis Window (samples) text box. The TSW1400 and TSW14J5x EVMs support FFT analysis lengths of as much as 524,288 samples, or as little as 1024 samples. In order to analyze the ADC Samples over a particular section of capture length, set the required “Analysis Window (samples)” appropriately and move the green cursor over the length of the context plot graph to include the desired section of ADC capture data to be considered for analysis. The red vertical line shown in the codes graph represents where the last sample is used from the captured data for analysis. The GUI will only allow record lengths that are the same size or smaller than the number of captured samples, which is set by the value in the capture option under the Data Capture Options tab (See Section 3.1.3.1). The default value is 65,536.
 Figure 3-30 Test
Parameters
Figure 3-30 Test
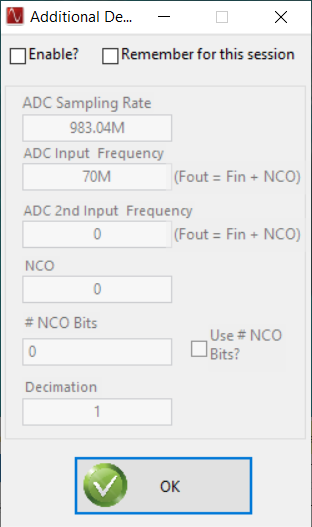
ParametersClicking on the Settings button (a gear) near the ‘ADC Output Data Rate’ opens a window as shown in Figure 3-31, which allows the user to specify the additional device parameters. Check “Enable” to enable this option.
 Figure 3-31 Additional Device Parameters
This additional setting is used to calculate the exact location of the spurs in the captured tone based on the following device parameters:
ADC Sampling Rate – Actual ADC sampling rate from the device. The ADC Output Data Rate value displayed in Figure 3-30 will be (Actual ADC Sampling Rate / Decimation).
ADC Input Target Frequency – Actual signal frequency on the device input.
ADC 2nd Input Target Frequency – Actual signal frequency on the second device input.
NCO – NCO frequency configured in the device that goes to the mixer. The NCO frequency provides a frequency shift of specified frequency value to the input tone. The spur search algorithm in HSDC Pro will account for this and identify the spurs properly.
# of NCO Bits – Number of NCO accuracy bits used in adjusting the user specified NCO frequency. To include the same amount in the calculation of NCO frequency, check on the “Use # NCO Bits?” The formula used to modify the User Specified NCO Frequency, based on the number NCO accuracy bits is given below. In order to use the # of NCO Bits, the “Auto Calc of Coherent Frequencies” should be enabled.

Decimation – Specifies the Decimation mode configured in the device.
Remember for this session – This will save the test parameter settings in case the board is disconnected or switched.