SNAA390 july 2023 LMK6C , LMK6D , LMK6H , LMK6P
- 1
- Abstract
- Trademarks
- 1Introduction
- 2Test Standards and Test Setup
- 3Sinusoidal Vibration, Random Vibration, and Mechanical Shock Tests
- 4Comparison of BAW Oscillator Vibration Performance With Crystal Oscillator
- 5Summary
- 6References
3.3.2 Results From Mechanical Shock Test
The results from the mechanical shock tests are shown in Figure 3-20 through Figure 3-23.
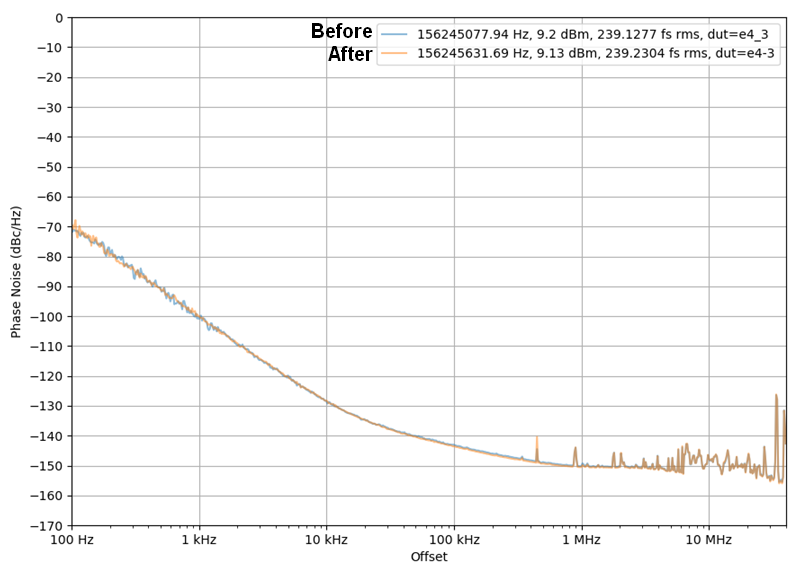 Figure 3-20 Plot of Before and After
Mechanical Shock Test of 4-pin DLE, Z axis
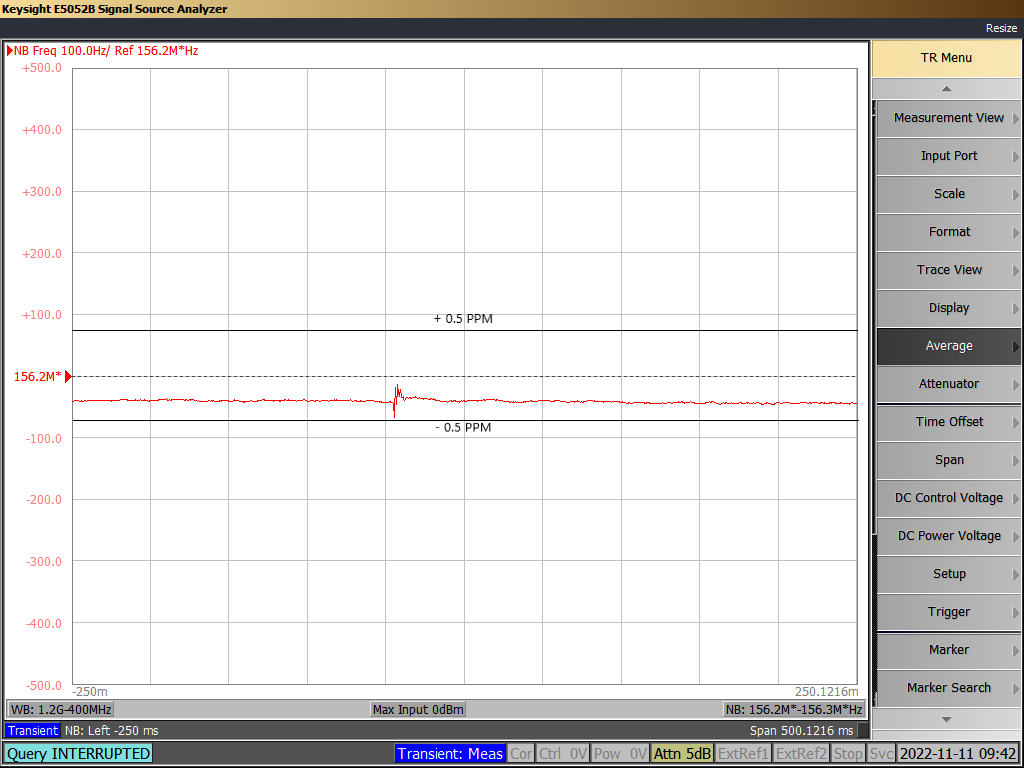 Figure 3-21 Capture During Mechanical
Shock Test of 4-pin DLE, Z axis
Figure 3-21 Capture During Mechanical
Shock Test of 4-pin DLE, Z axisThe scale for the y - axis is in Hz (Hertz) and the markers are provided for 0.5 PPM on either side of the variation in the plot for easy reference for understanding PPM variation.
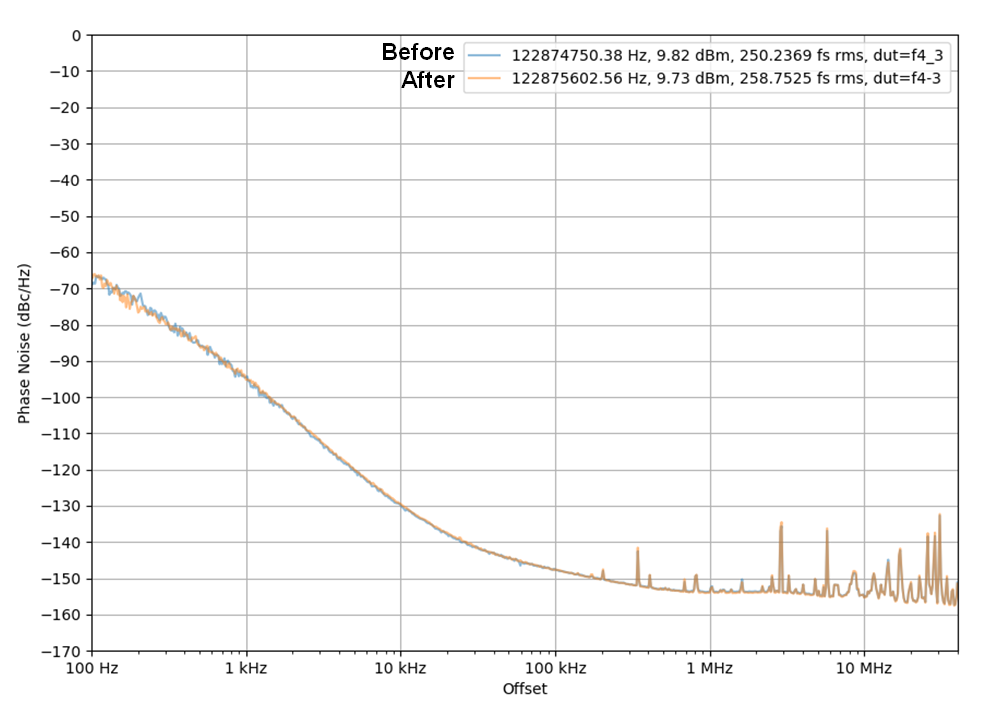 Figure 3-22 Plot of Before and After
Mechanical Shock Test of 4-pin DLF, X axis
 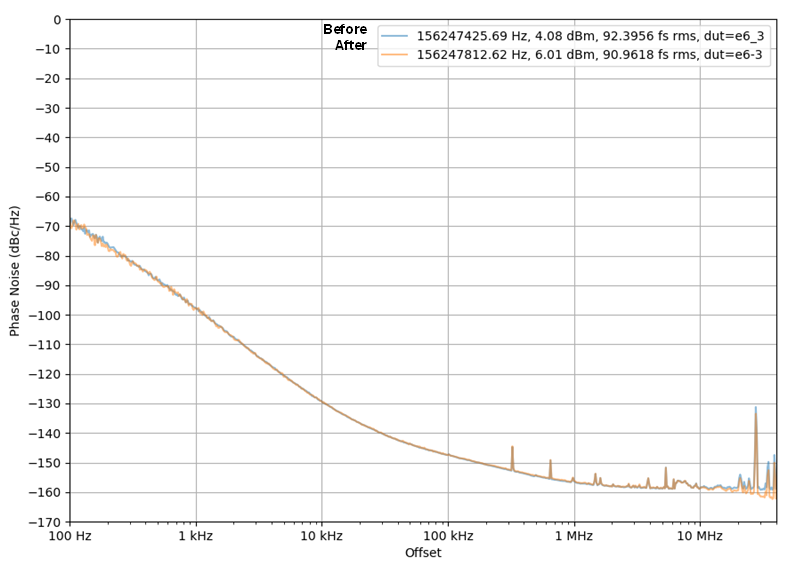 Figure 3-24 Plot of Before and After
Mechanical Shock Test of 6-pin DLE, Y axis
 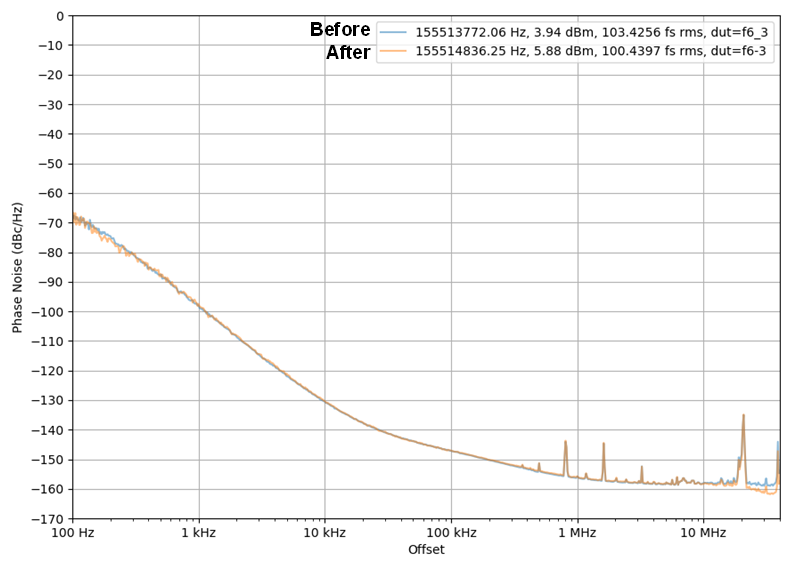 Figure 3-26 Plot of Before and After
Mechanical Shock Test of 6-pin DLF, Y axis
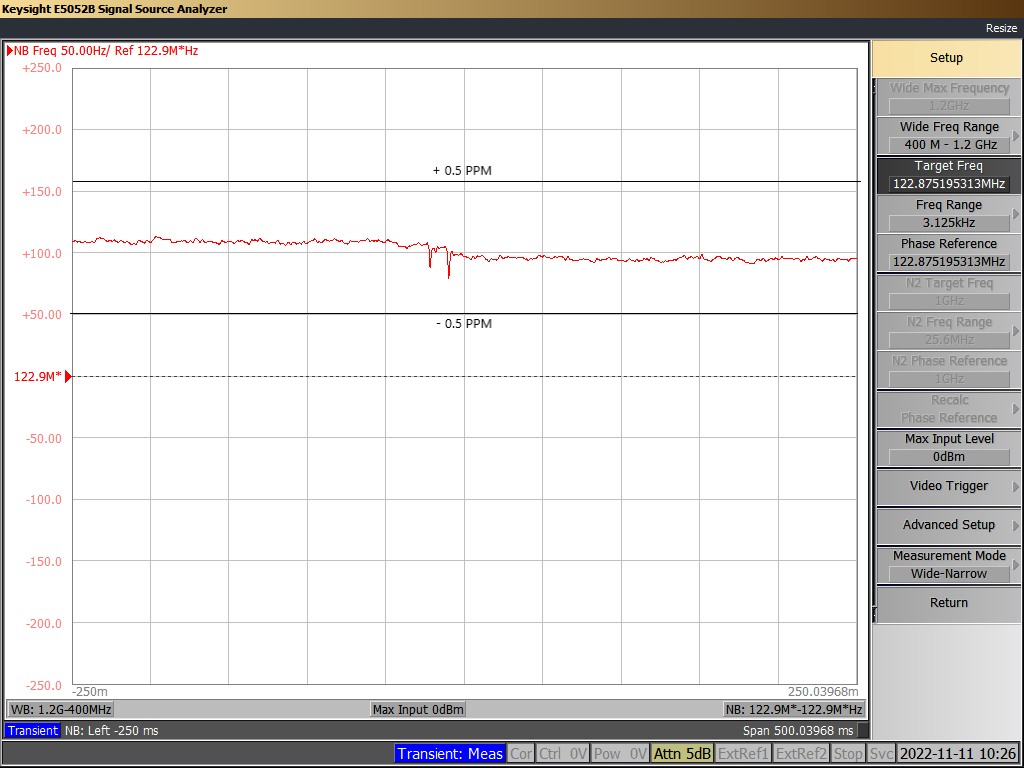 Figure 3-23 Capture of During
Mechanical Shock Test of 4-pin DLF, X axis
 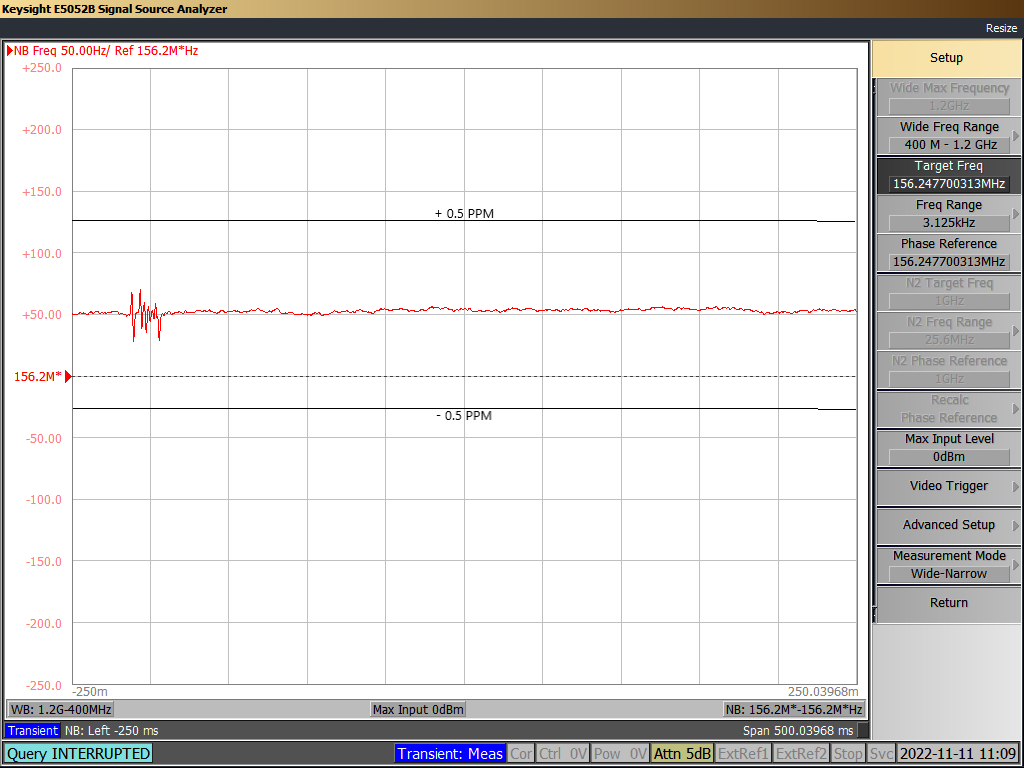 Figure 3-25 Capture During Mechanical
Shock Test of 6-pin DLE, Y axis
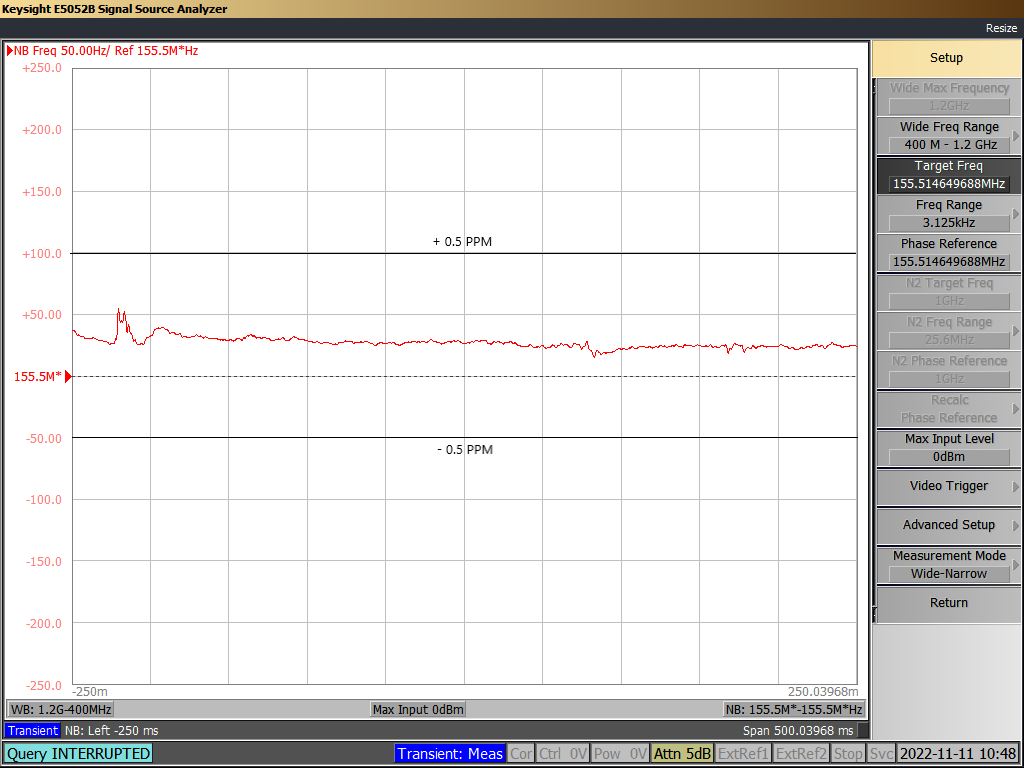 Figure 3-27 Capture During Mechanical
Shock Test of 6-pin DLF, Y axis
Figure 3-27 Capture During Mechanical
Shock Test of 6-pin DLF, Y axisThe ppm variation is observed to be negligible during the mechanical shock test, with the variation at less than 0.5 ppm and the device operating normally after the test.