SNAA417 September 2024 LMH1239
2 Analysis of the Pathological Pattern
In discussing pathological video pattern, do not mix up pothole in the SDI bitstream due to TRS (Timing Reference Signal) words and the true pathological data patterns exhibited during the active portion of the data pattern. TRS is sent at the beginning and end of the active video signal. The receiver detects the TRS to figure out both the word and line alignment for the signal. At the end of each line, there are a couple of extra words inserted which tell the receiver what the line number is. A CRC is also included, so that the receiver can know if pattern has properly received all of the data in the line.
In a 3G SDI data pattern, the TRS of a line is 0x3FF, 0x3FF, 0x00, 0x00, 0x00, 0x00. This is a sequence of 20 “1” followed by 40 “0” bits. Even after scrambling, this sequence can cause a DC shift or pothole in the scrambled SDI data pattern. As noted in RP 198, the frequency where scrambling of the TRS words coincides with the required scrambler state to allow this stressing pattern is low. Even when this occurs, the timing duration of this stressing pattern is time limited that equalizers or retimer PLL is not stressed to the point where this can cause an issue.
However, in 12G data stream, this pothole effect is much worse because 12G SDI is comprised of 4 multiplexed 3G data streams. This means TRS can contain a sequence of 80 “1” bits followed by 160 “0” bits. This bit stream causes a huge DC wander and causes problems for AC coupled equalizers used in SDI applications. To get around this issue, SMPTE ST2081 and ST2082 revised an anti-pothole pattern whereby the TRS word is modified such that all of 0x3FF – except one – are modified to 0x002. This means that the TRS pothole is similar to a 3G SDI signal.
As noted earlier, SMPTE RP198 defines two different pathological video patterns that create the worst case data pattern for the SDI equalizer and retimer:
Equalizer Test: A sequence of 19 “0” bits followed by a single “1” bit or 19 “1” followed by a single “0”. This pattern creates maximum the DC wander and is generated using a repeated sequence of 0x300, 0x198 10-bits values prior to scrambling. Note the overall data within the video frame is DC balanced – meaning there is the same number of ones and zeros. However, there can be one or two lines where we can observe DC wander due to this consecutive 19 “0” and 1 “1” or vice versa.
PLL Test: A sequence of 20 “0” followed by 20 “1” bits. This pattern represents the lowest frequency data pattern possible to be transmitted on the SDI data stream. This is generated using a repeated sequence of 0x200 and 0x100 (10-bits values) prior to scrambling.
SMPTE specifications has not provided a specification similar to RP198 for ST-2081 and ST-2082 standards. However, the implementation of this pattern for a 12G SDI link is a bit more complex. 12G SDI signals multiplex 4-3G streams. To create this stressed data pattern at the output of the multiplexed data, the output pixel stream needs to be either 0x300, 0x198(EQ pathological) or 0x200, 0x110 values(PLL pathological) after the four 3G virtual links have been muxed together. This means that actual pixel values in the raw unmuxed image needs to appear or be forced as follows:
Line n: All Y and C pixels needs to have a value of 0x300(equalizer pattern) or 0x200(PLL pattern).
Line n+1: All Y and C pixels needs to contain value of 0x198(equalizer pattern) or 0x110(PLL pattern).
Note these 12G pathological patterns do not have the old gray and pink coloration of the 3G pattern.
To see more clearly show how this mapping works, Figure 2-1.
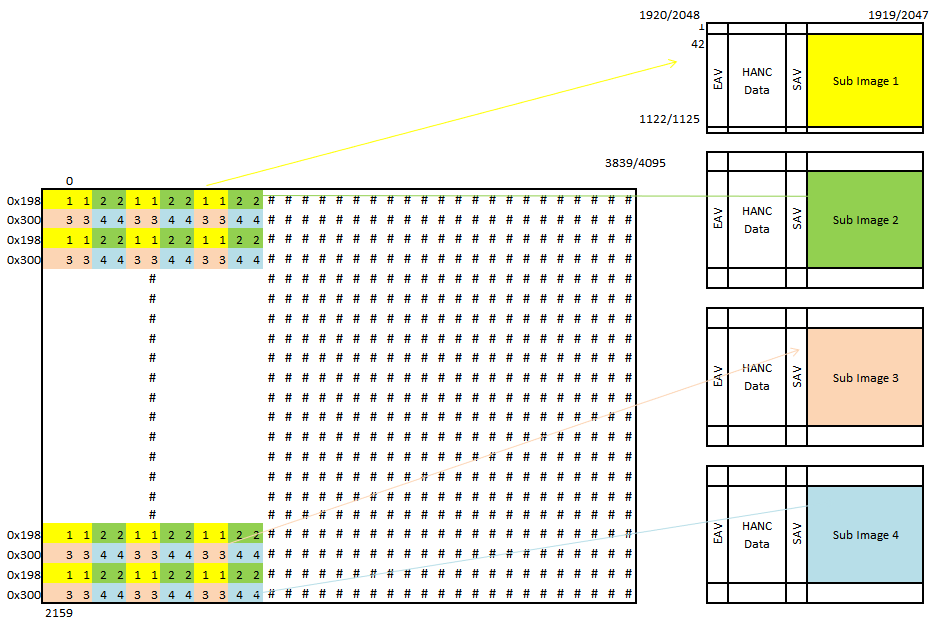 Figure 2-1 Sub Image Breakdown of a Monitor Receiving the Pathological Pattern
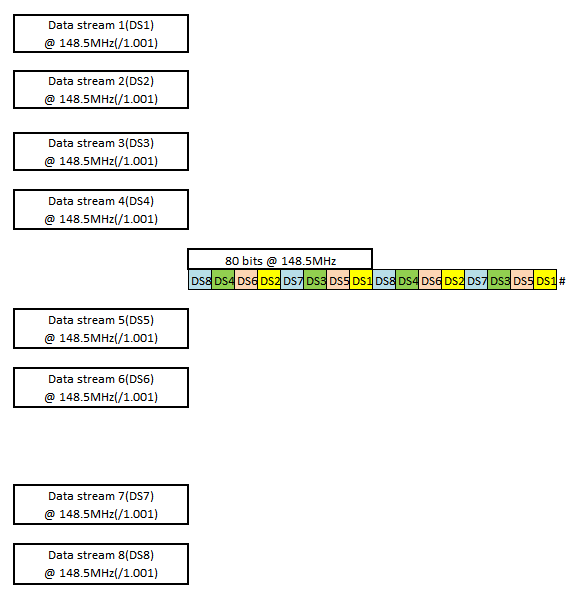 Figure 2-2 SDI Pattern for Interleaved Data Streams
As noted in the mapping above, sub-image1 and sub-image2 needs to be forced to 0x198 value while sub-image3 and 4 to 0x300 value. Then these four sub-images get mapped into 8 inter-leaved data streams to form an 80bits at 148.5MHz rate to generate this stressful pattern.
4K/UHD offers two high resolutions: 4096x2160 for cinematic distribution or 3840x2160 for home distribution. Given the mapping structure, we have two interleaved lines of source mapping to 4 sub-images/8 streams. Therefore, the pathological pattern exists for two active line times. At 4096 pixels multiplied by 20 (assuming 422 conversion) and multiplied by 2 for two rows at 10 bits/pixel, we have 163,840 bits. At 11.88Gbps this gives us 13.79µs pathological length time. However, some test equipment manually creates the pathological pattern by forcing contents of sub-images 1 through 4.
SMPTE ST-2082 uses either 10-bits or 12-bits per pixel for AFR(Additional Frame rate). 10-bits per pixel has two mapping structures outlined in ST-2036-1, ST-2048-1 3840X2160 and 4096X2160 at 48/50/60 or /1.001 frame rates. Mapping structures 1 and 2 use 10-bits per pixel. Also, mapping structures 3 and 4 uses 10-bits per pixel and the 9th bit is a complement of the 8th bit – therefore pathological cannot occur.
There is also 12-bits AFR(ST-2036-1, ST-2048-1) 3840X2160 and 4096X2160 at 24/25/30 frame rate. In this structure, every other pixel 9th bit is a complement of the 8th bit and bits 0 at 1 are set to 0. Again, here pathological cannot occur. As described earlier, some test equipment vendors implemented 10-bits per pixel 12G SDI pathological by manually forcing all line n Y and Cr to have 0x300 value while line n+1 to have 0x198 value – as noted earlier. This creates a video signal that has significant noise-free flat field and is manually created.
The following are pathological patterns captured on different instruments:
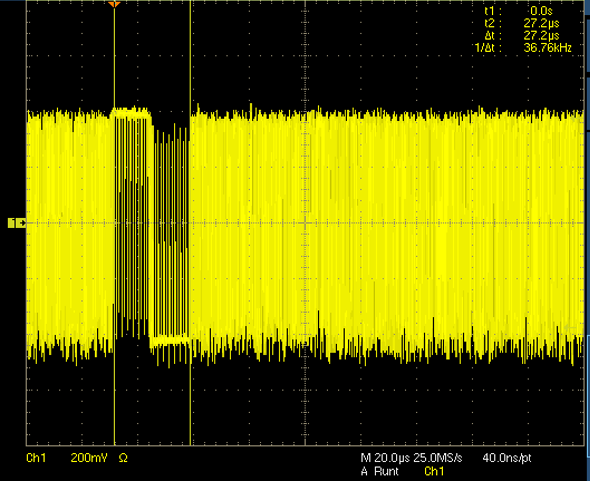 Figure 2-3 3G-A 1080p60 DC Wander: Inverse Polarity Stress Pattern
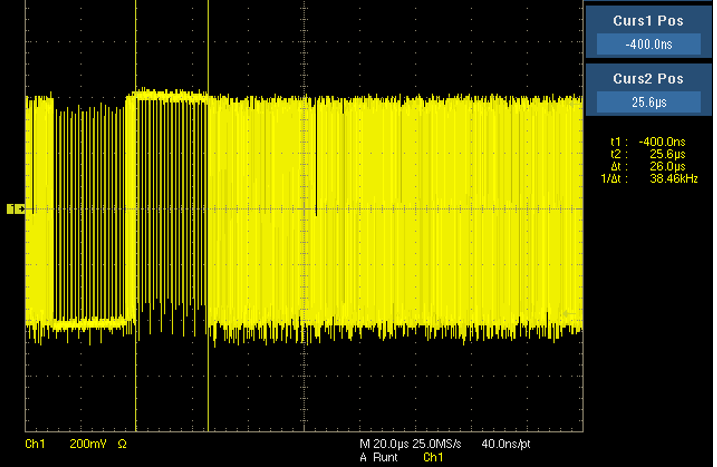 Figure 2-5 HD 1080p30 DC Wander: Inverse Polarity Stress Pattern
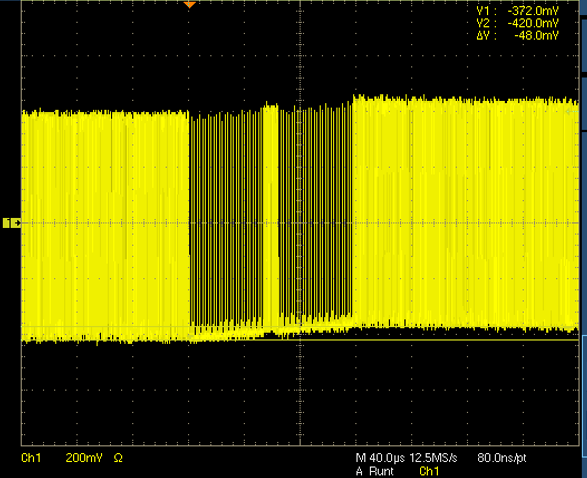 Figure 2-7 SD625i DC Wander: A Consecutive Stress Pattern Increasing DC Wander
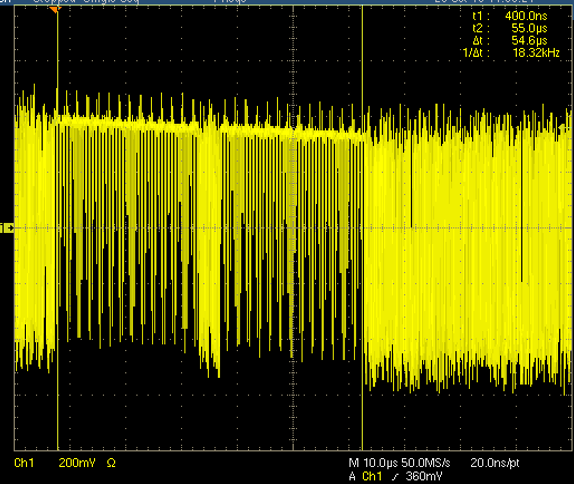 Figure 2-9 6G DC Wander: A Consecutive Stress Pattern Increasing DC Wander
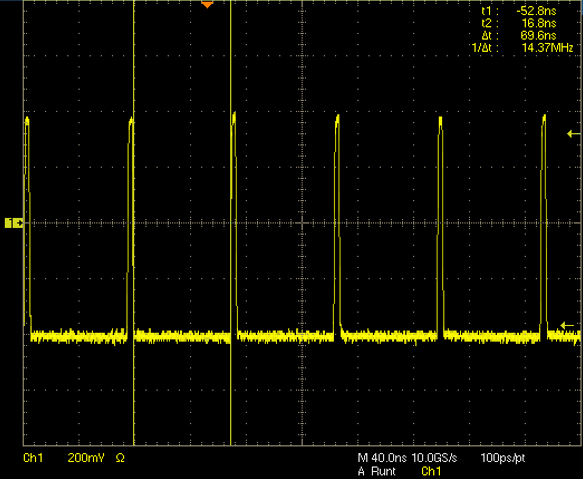 Figure 2-11 Pulse Period for a 270Mbps Pathological With
19 Zeros and 1 one
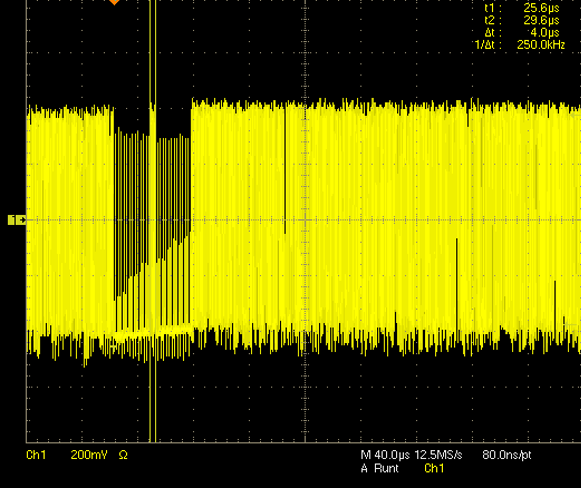 Figure 2-4 1080p60 3G-B DC Wander: A Consecutive Stress Pattern
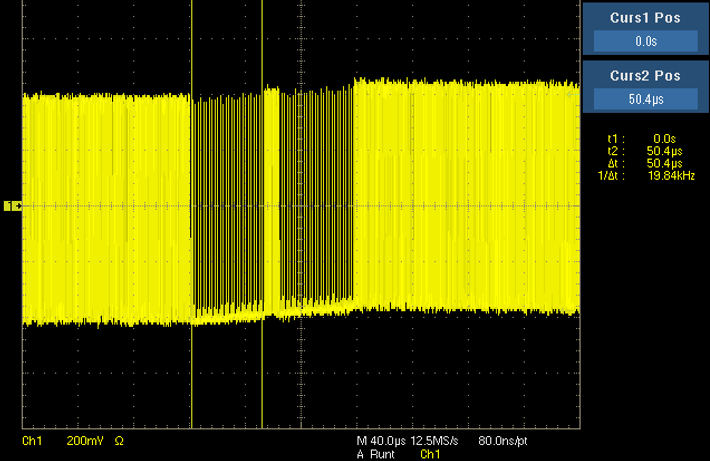 Figure 2-6 SD625i DC Wander: A Consecutive Stress Pattern Increasing DC Wander
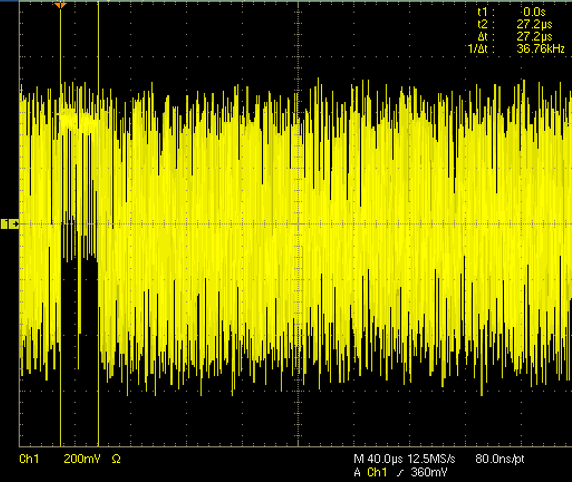 Figure 2-8 12G DC Wander: A Consecutive Stress Pattern Increasing DC Wander
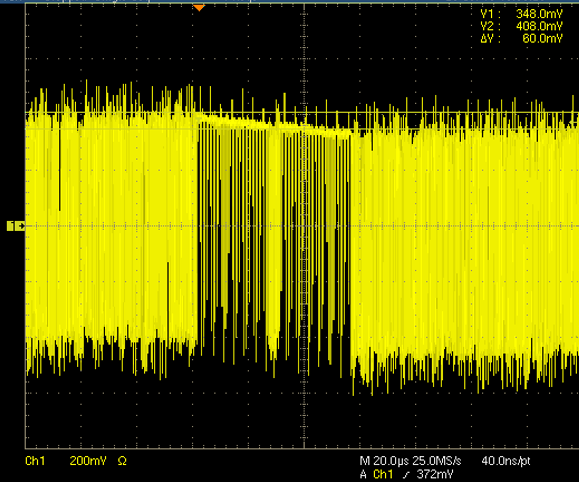 Figure 2-10 3G DC Wander: A Consecutive Stress Pattern Increasing DC Wander
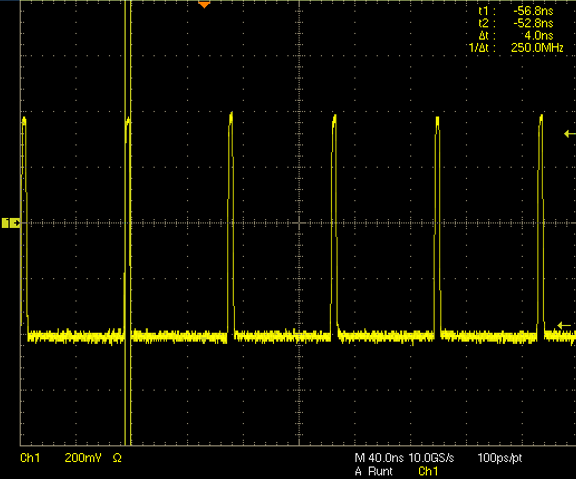 Figure 2-12 Pulse Width for a 270Mbps Pathological With 19 Zeros and 1 one
The latest 12G SDI generators and analyzers have provided additional stress patterns to further check the performance of a receiver in harsher environment where there is both EQ pathological and high transition density clock patterns. Even though we can observe signal strength throughout the low frequency bandwidth, we can also observe strong clock frequency or signal strength. Examples below show different 12G pathological in real-time and frequency domain. Below are waveforms are captured using a 7dB 75ohm-to-50ohm adapter block comparing different video patterns in the frequency domain.
Note at 11.88GHz there is a signal presence due to the color bar 12G SDI video pattern. Usually for differential systems, there can be a null at 2×Nyquist and we can not see this tone. However, since for SDI we have single-ended signaling, any asymmetry between rise and fall transitions can lead to this tone.
Note at 11.88GHz there is a signal presence due to the color bar 12G SDI video pattern. Usually for differential systems, there can be a null at 2×Nyquist and we can not see this tone. However, since for SDI we have single-ended signaling, any asymmetry between rise and fall transitions can lead to this tone.
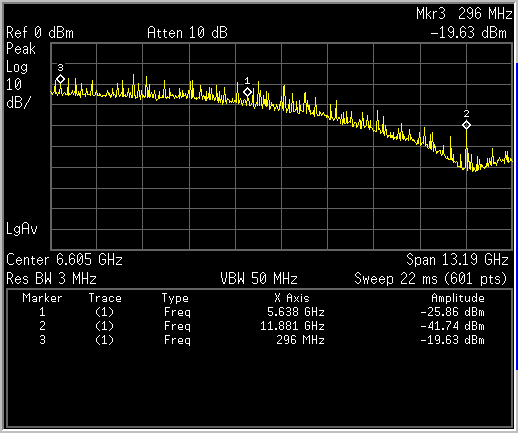 Figure 2-13 12G SDI 3840X2160 Colorbar Pattern
Note signal presence at 12G SDI Nyquist, divided by 1.001, PLL clock pattern at 5.638GHz, and divided by 40 (297MHz)
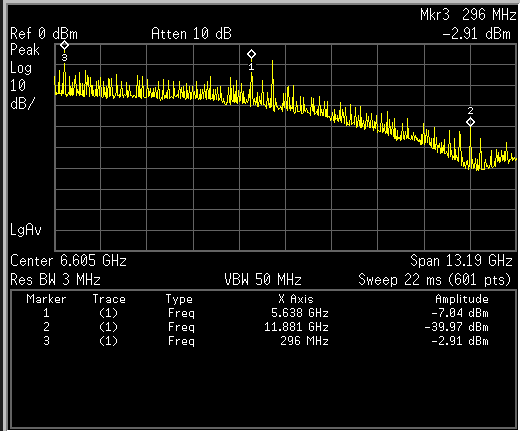 Figure 2-14 Checker Field, PLL, Plus Clock Pattern
For a pure 12G SDI equalizer pattern, we see more low frequency, a wider spectrum of signal content and there is not a strong clock presence.
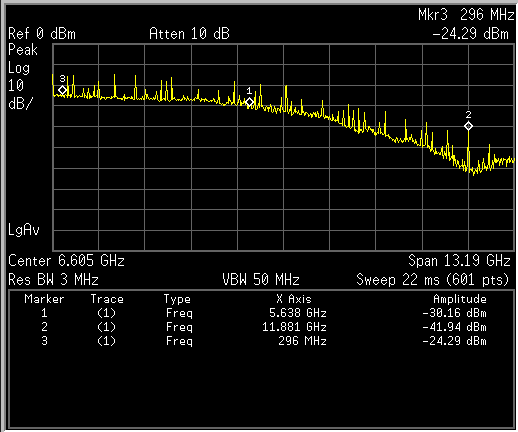 Figure 2-15 12G SDI EQ Pathological
This pattern shows EQ pathological plus strong clock presence at Nyquist and Nyquist or divided by 1.001 based on whether we area using frame rate – for example 60Hz – or divided by 1.001 frame rate – 59.94Hz.
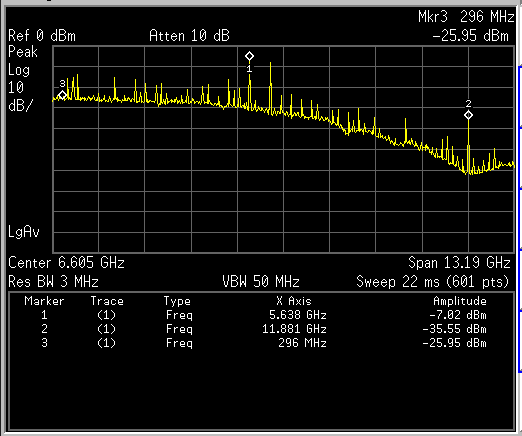 Figure 2-16 Clock Pattern With EQ Pathological and Clock Pattern
Since PLL pathological is 20 zero and 20 ones or vice versa, there is a clock pattern at 11.88(or divided by 1.001) divided by 40(20 zeros 20 ones) at about 296MHz:
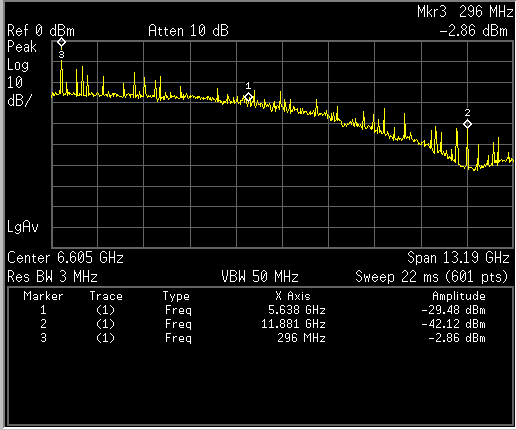 Figure 2-17 PLL Pathological
LMH1239/1229 Pathological Performance:
LMH1239/1229 devices were designed to support the pathological video pattern. DC wander correction circuitry was designed in to compensate for the wander, drift or shift caused by uneven number of zeros and ones. The devices were characterized over temperature, launch amplitude, and cable length using a mix of checkfield, clock, and PLL patterns.
- When using this SDI generator/analyzer for pathological performance measurement, the generator/analyzer needed to be calibrated. For example, using Phabrix 12G SDI QX series SDI video generator/analyzer, we need to use system settings -> Driver Calibration procedure.
- Given RF inference, the recommendation is to turn off cell phone or wifi when using the EVM in an open fixture environment. RF noise interference can add additional noise reducing the overall cable reach.
- These were measured using B1694A cables. The expectation is to have additional 20 to 25% additional cable reach when using 5.5CUHD cable.
- For these measurements, SDI_OUT was disabled.
| Video Rate | Typical 100% Colorbar Reach (m) | Typical Checkfield+PLL+Clock+ Colorbar Reach (m) |
|---|---|---|
| 12G | 100 | 90 |
| 6G | 150 | 140 |
| 3G | 220 | 220 |
| HD | 300 | 300 |
| SD | 600 | 600 |