SNIK005 august 2023 TMP9R00-SP
3.2.1 Histogram of Temperature Events Exceeding ±1.5°C
 Figure 3-2 Local Channel
 Figure 3-4 Channel 2
 Figure 3-6 Channel 4
 Figure 3-8 Channel 6
 Figure 3-10 Channel 8
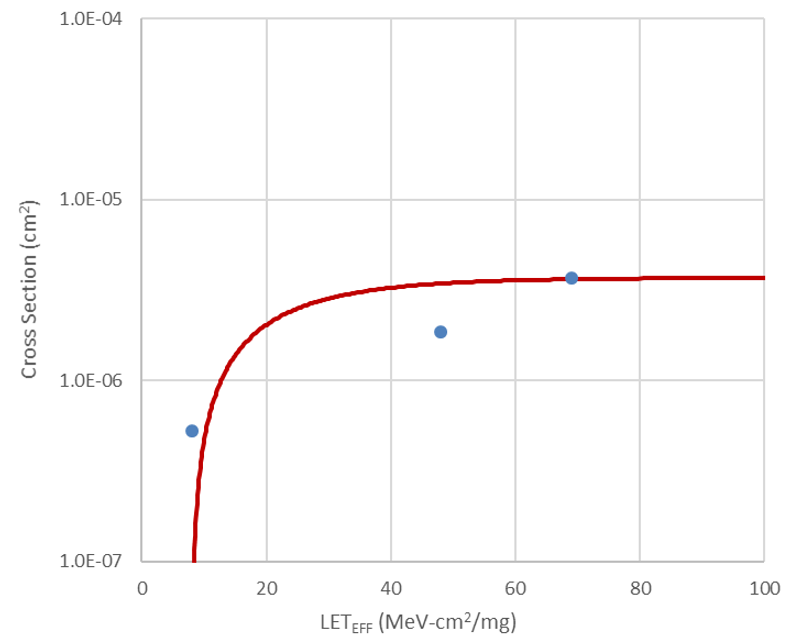 Figure 3-12 Weibull Plot: V+ 2.0 V -
Local Channel
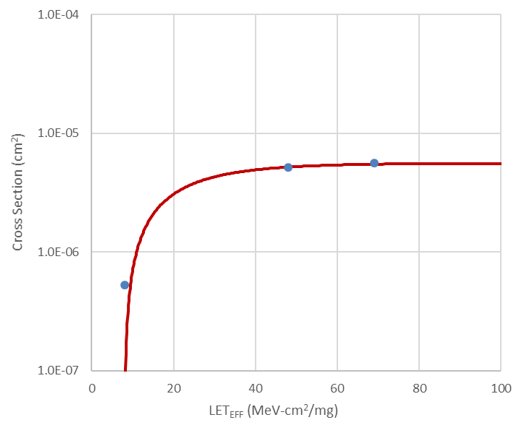 Figure 3-14 Weibull Plot: V+ 2.0 V -
Channel 1
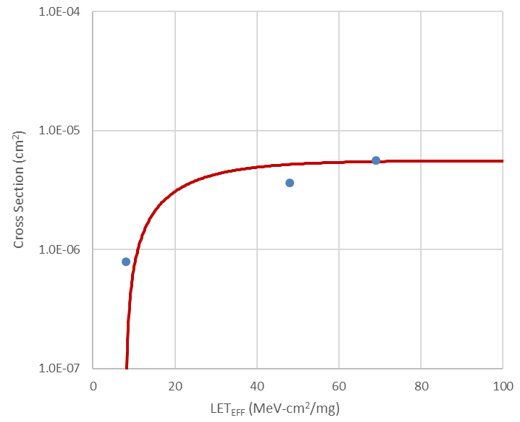 Figure 3-16 Weibull Plot: V+ 2.0 V -
Channel 2
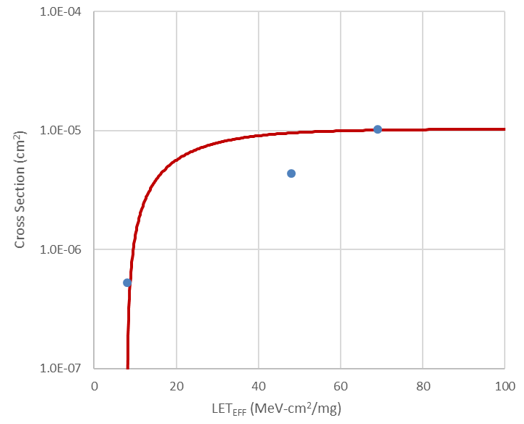 Figure 3-18 Weibull Plot: V+ 2.0 V -
Channel 3
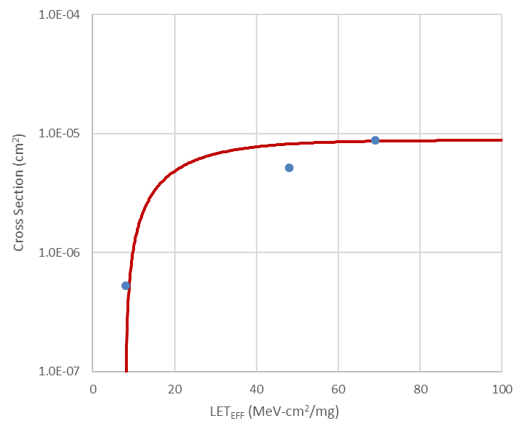 Figure 3-20 Weibull Plot: V+ 2.0 V -
Channel 4
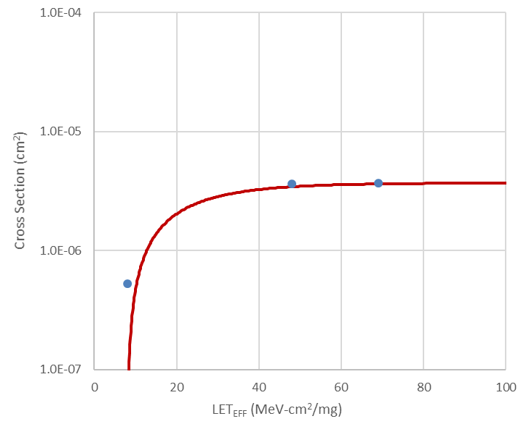 Figure 3-22 Weibull Plot: V+ 2.0 V -
Channel 5
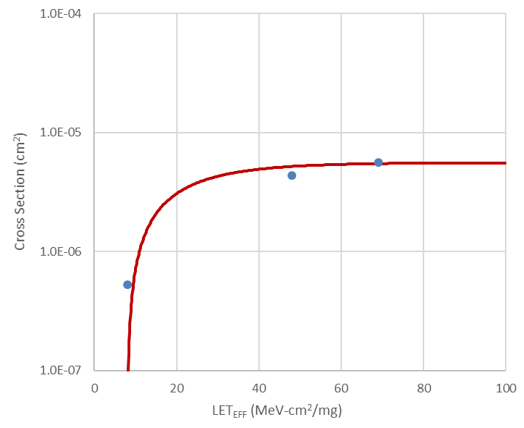 Figure 3-24 Weibull Plot: V+ 2.0 V -
Channel 6
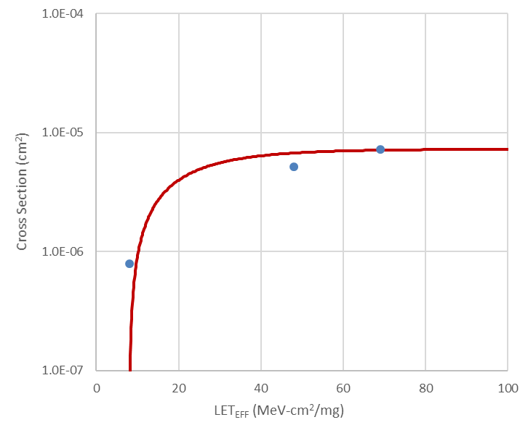 Figure 3-26 Weibull Plot: V+ 2.0 V -
Channel 7
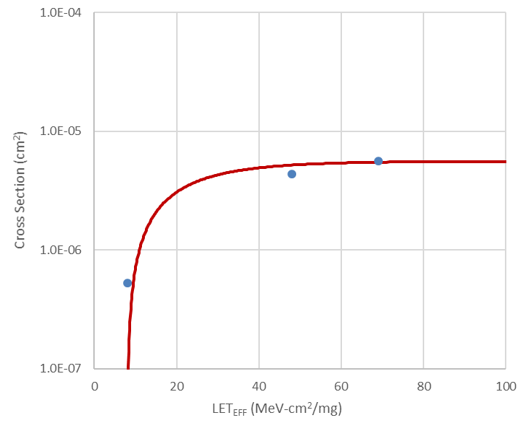 Figure 3-28 Weibull Plot: V+ 2.0 V -
Channel 8
 Figure 3-3 Channel 1
 Figure 3-5 Channel 3
 Figure 3-7 Channel 5
 Figure 3-9 Channel 7
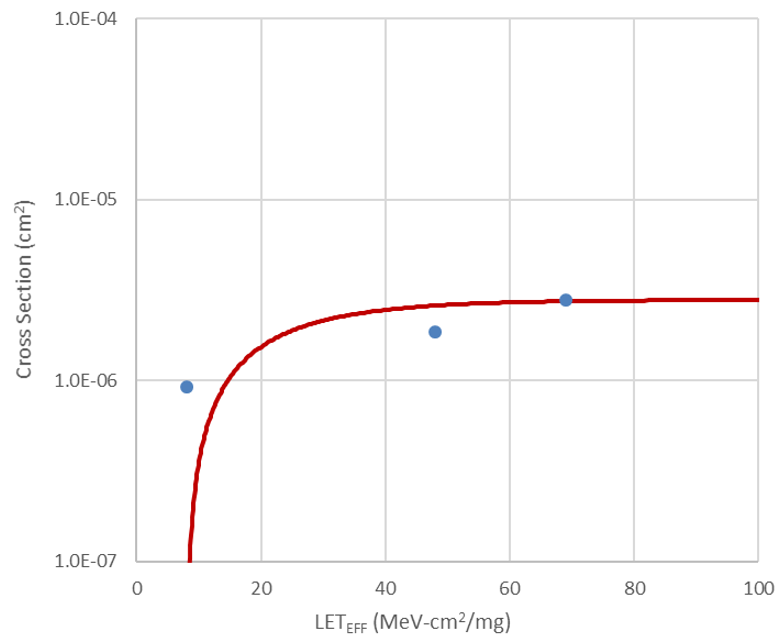 Figure 3-11 Weibull Plot: V+ 1.7 V -
Local Channel
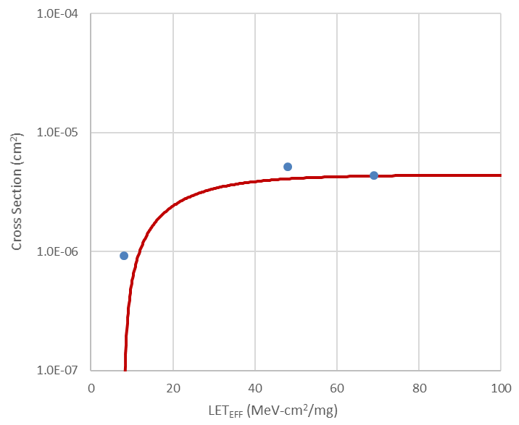 Figure 3-13 Weibull Plot: V+ 1.7 V -
Channel 1
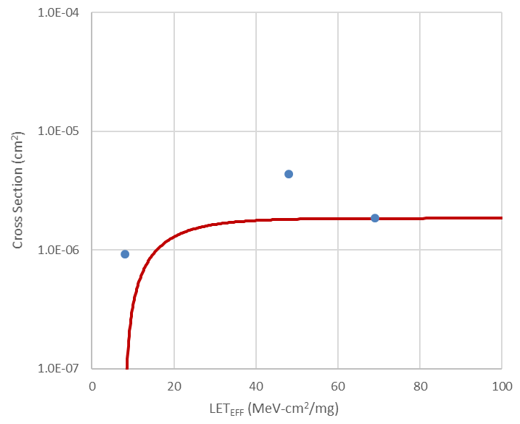 Figure 3-15 Weibull Plot: V+ 1.7 V -
Channel 2
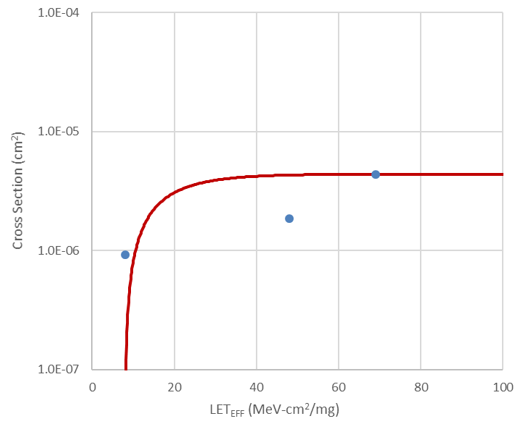 Figure 3-17 Weibull Plot: V+ 1.7 V -
Channel 3
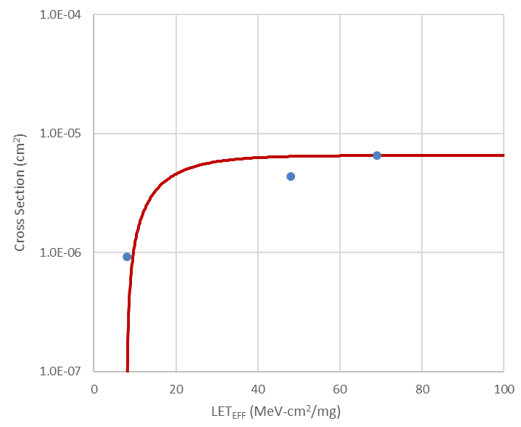 Figure 3-19 Weibull Plot: V+ 1.7 V -
Channel 4
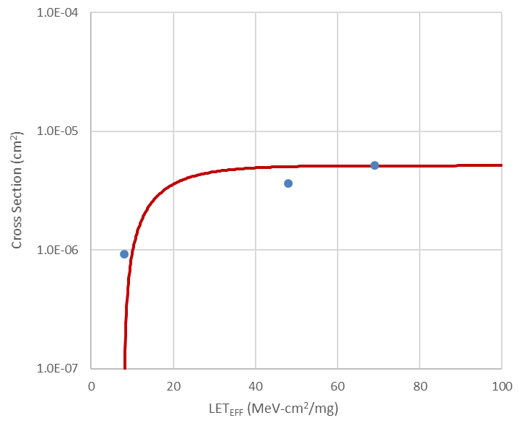 Figure 3-21 Weibull Plot: V+ 1.7 V -
Channel 5
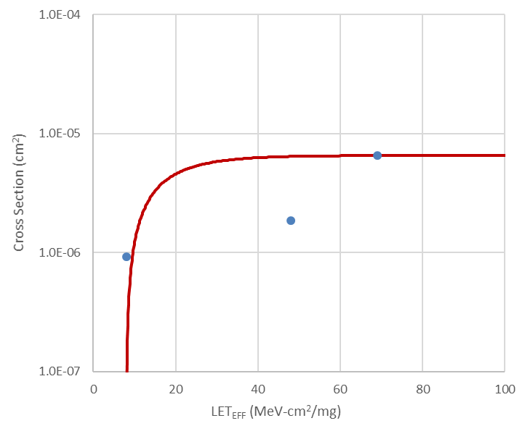 Figure 3-23 Weibull Plot: V+ 1.7 V -
Channel 6
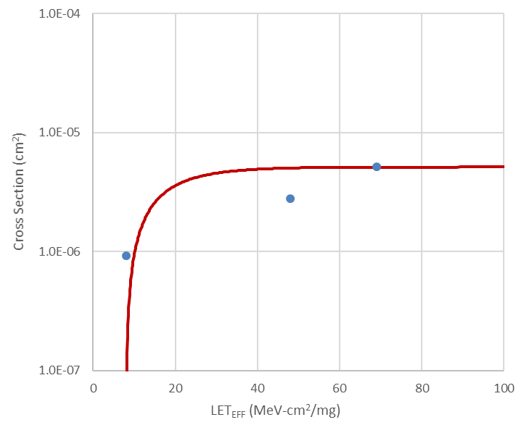 Figure 3-25 Weibull Plot: V+ 1.7 V -
Channel 7
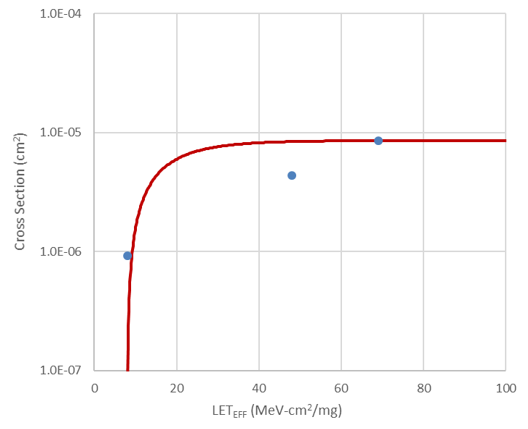 Figure 3-27 Weibull Plot: V+ 1.7 V -
Channel 8