SNVA869 November 2020 LP875761-Q1
6 Measurements
Test data can be found in the Application Curves section of the LP875761-Q1 Four-Phase 3-MHz 1-V 16-A DC/DC Buck Converter With Integrated Switches Datasheet.
Additional bench test data for load transient response, efficiency, and phase margin can be seen in this section at different input voltages.
Measurements were taken on LP875761Q1EVM with default components. For load transient a special high speed amplifier controlled current sink was used to realize 4 A to 12 A to 4 A transient with 1 µs slew rate (8A / µs).
Control loop response (Bode plot) was measured with Keysight MSOX6004A oscilloscope.
 Figure 6-1 LP875761-Q1 Efficiency at Vin
= 5 V and Vin = 3.3 V
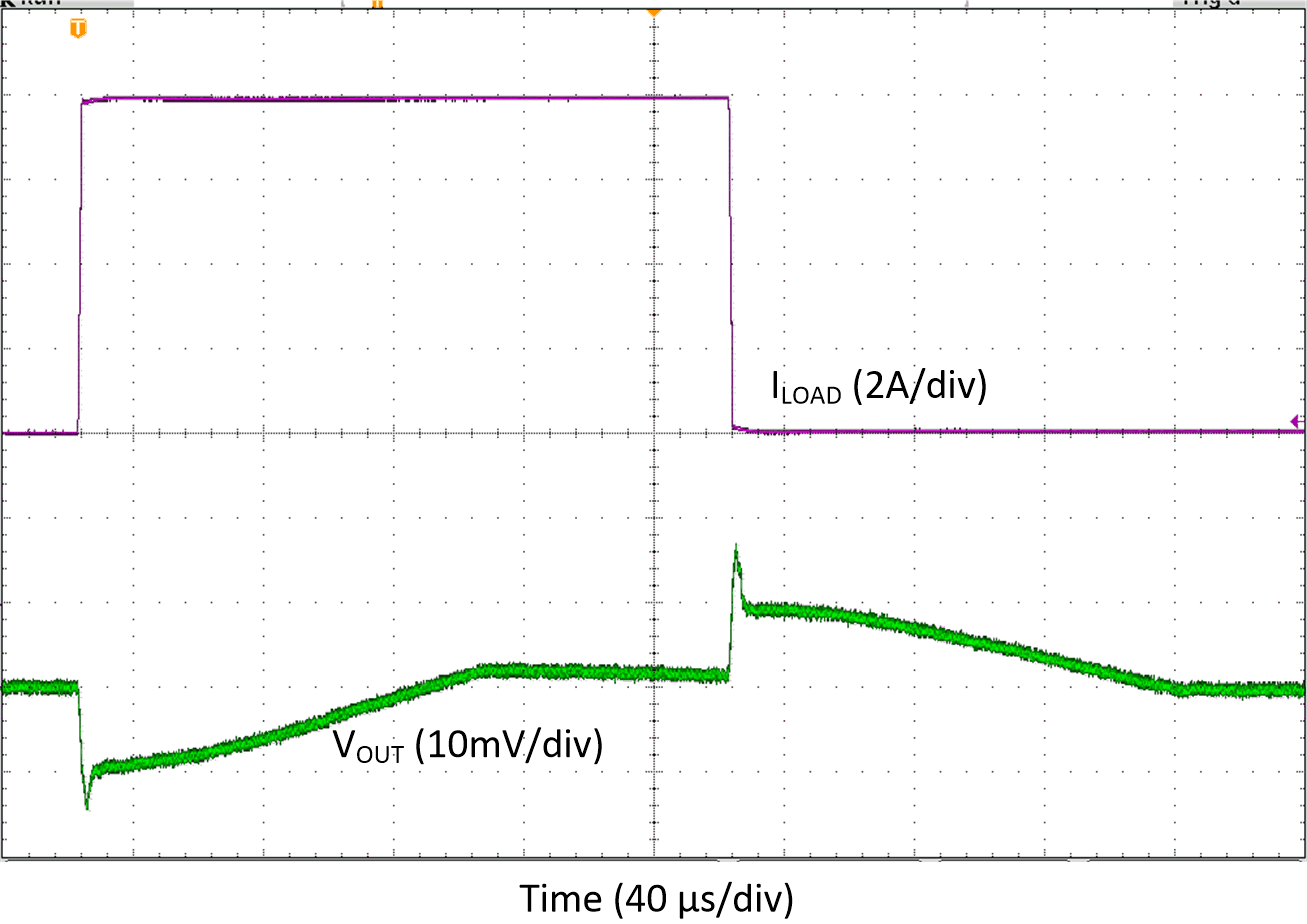 Figure 6-2 LP875761-Q1 Load Transient
Response at Vin = 5 V, 25°C. -13.7 mV / +17.2 mV
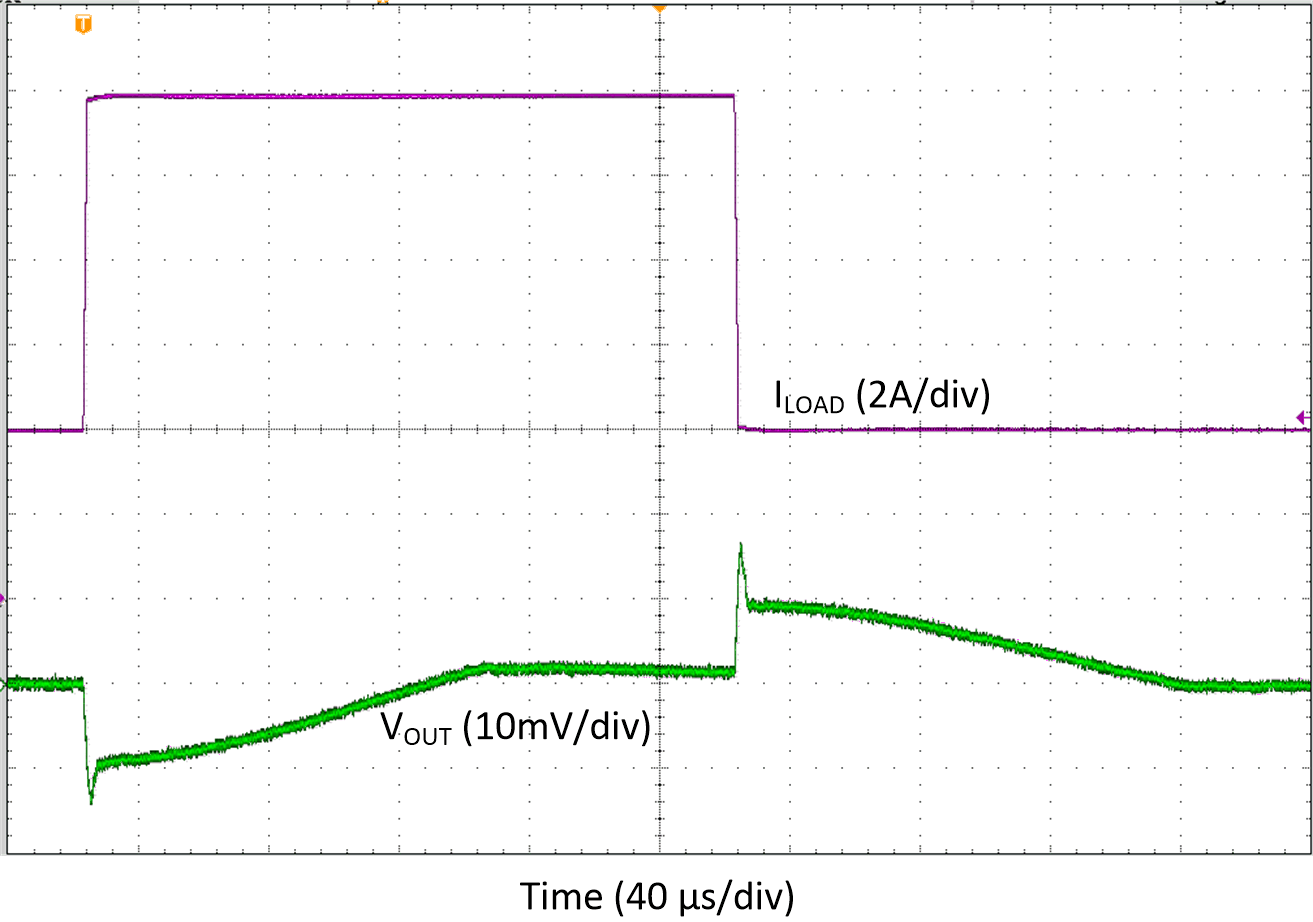 Figure 6-4 LP875761-Q1 Load Transient
Response at Vin = 5 V, -40°C. -14.0 mV / +16.8 mV
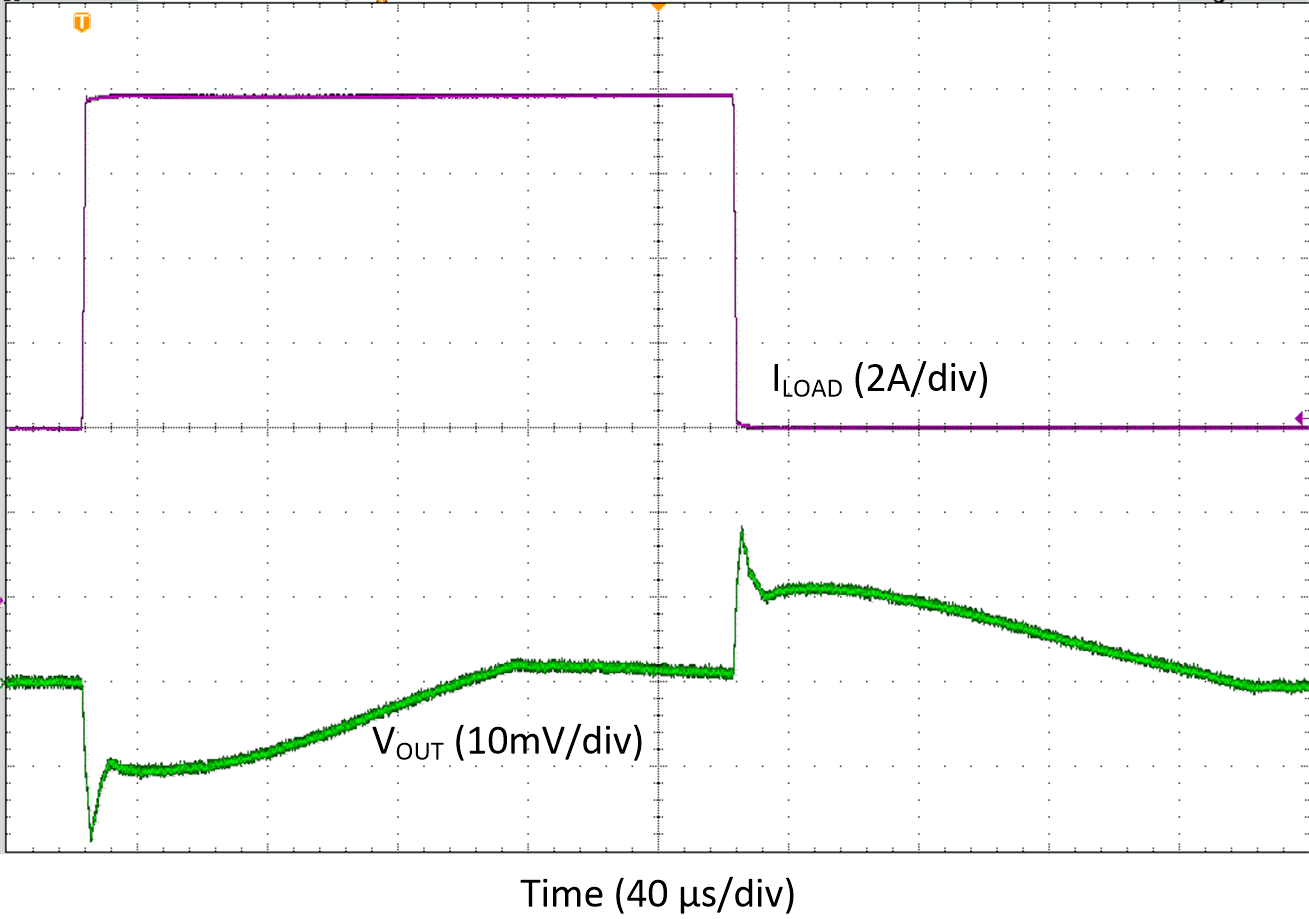 Figure 6-6 LP875761-Q1 Load Transient
Response at Vin = 3.3 V, 125°C. -18.1 mV / +18.2 mV
 Figure 6-8 LP875761-Q1 Phase Margin /
Bode Plot at Vin = 5 V, 25°C
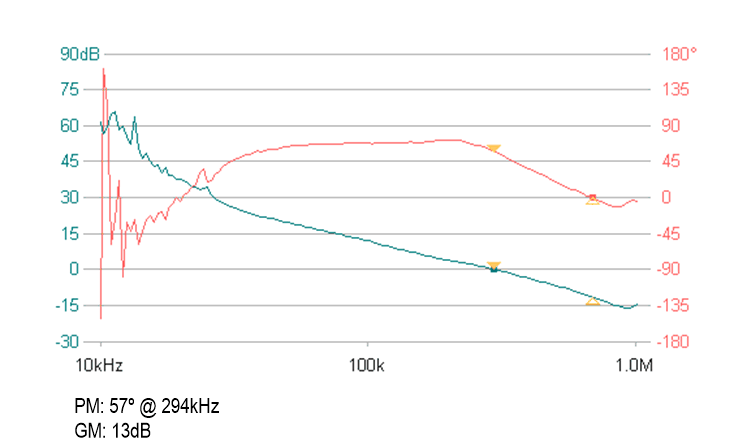 Figure 6-10 LP875761-Q1 Phase Margin /
Bode Plot at Vin = 5 V, -40°C
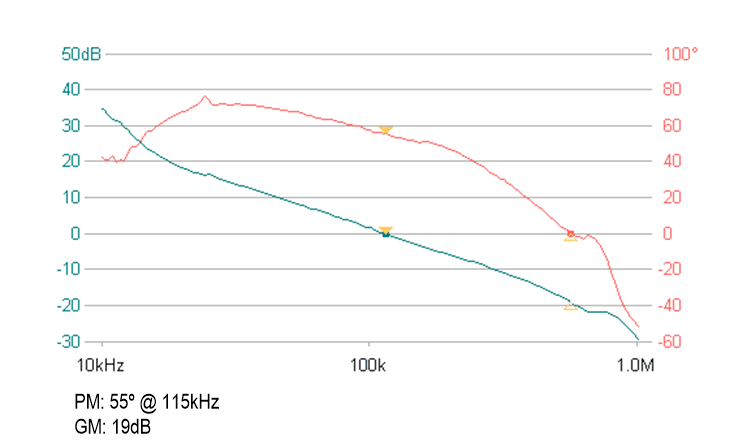 Figure 6-12 LP875761-Q1 Phase Margin /
Bode Plot at Vin = 3.3 V, 125°C
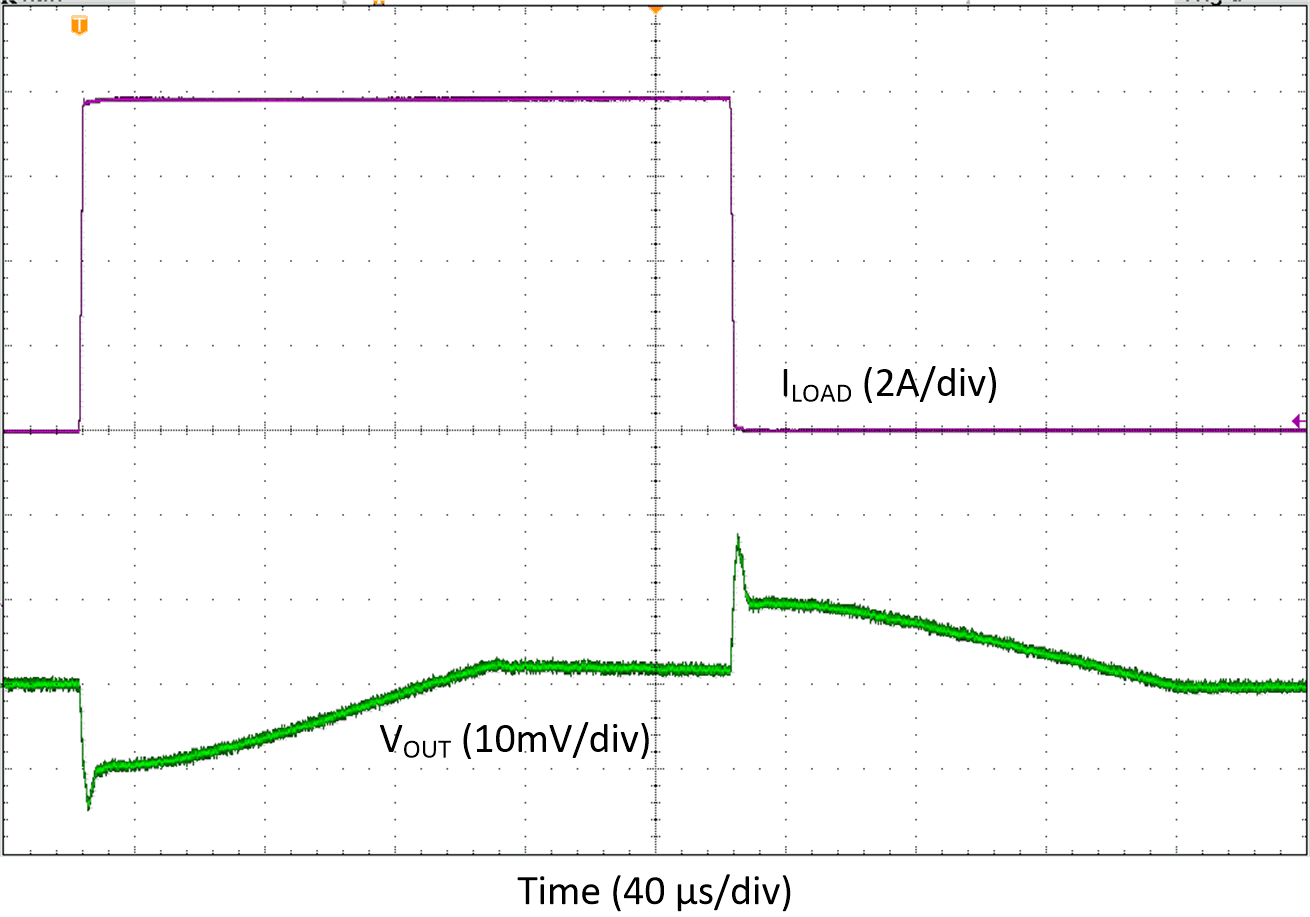 Figure 6-3 LP875761-Q1 Load Transient
Response at Vin = 5 V, 125°C. -14.3 mV / +17.7 mV
 Figure 6-5 LP875761-Q1 Load Transient
Response at Vin = 3.3 V, 25°C. -17.7 mV / +18.0 mV
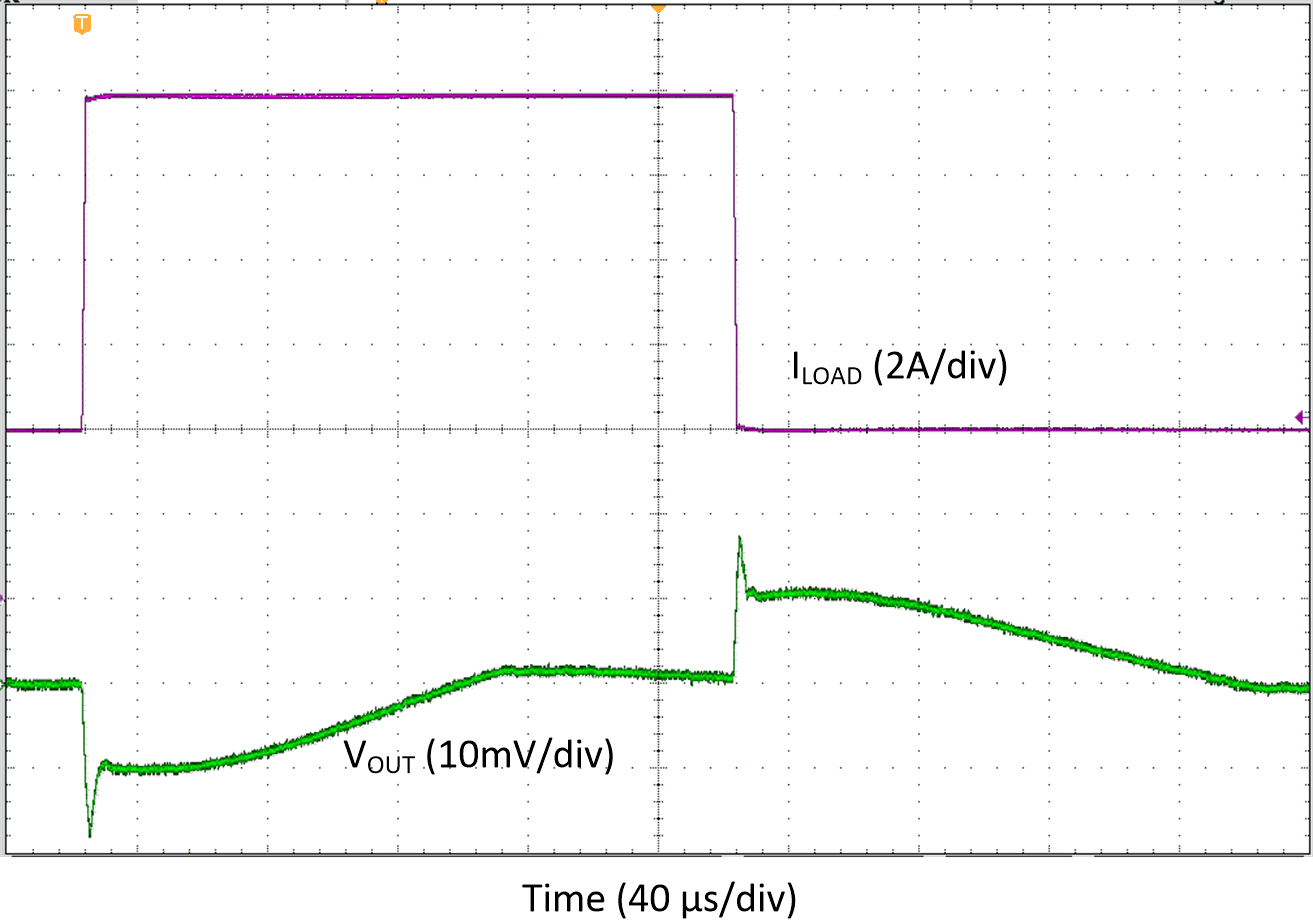 Figure 6-7 LP875761-Q1 Load Transient
Response at Vin = 3.3 V, -40°C. -17.3 mV / +17.6 mV.
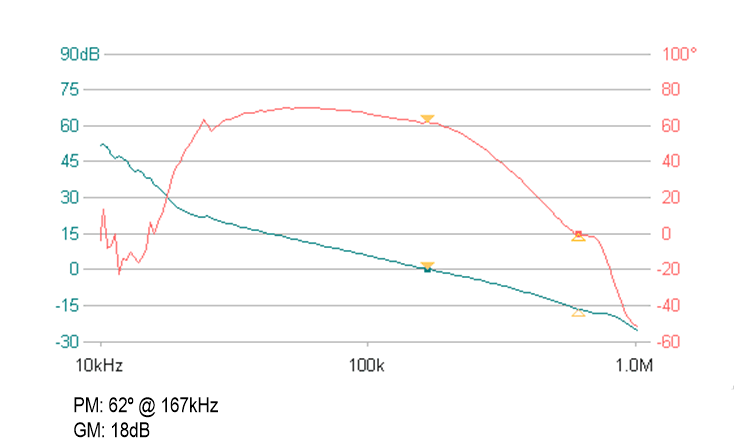 Figure 6-9 LP875761-Q1 Phase Margin /
Bode Plot at Vin = 5 V, 125°C
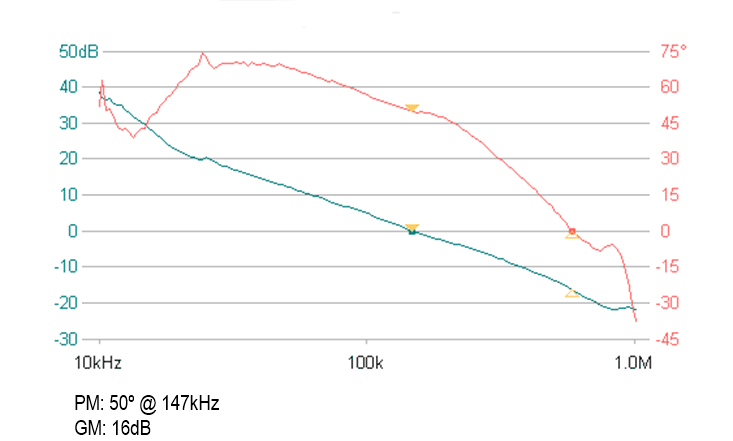 Figure 6-11 LP875761-Q1 Phase Margin /
Bode Plot at Vin = 3.3 V, 25°C
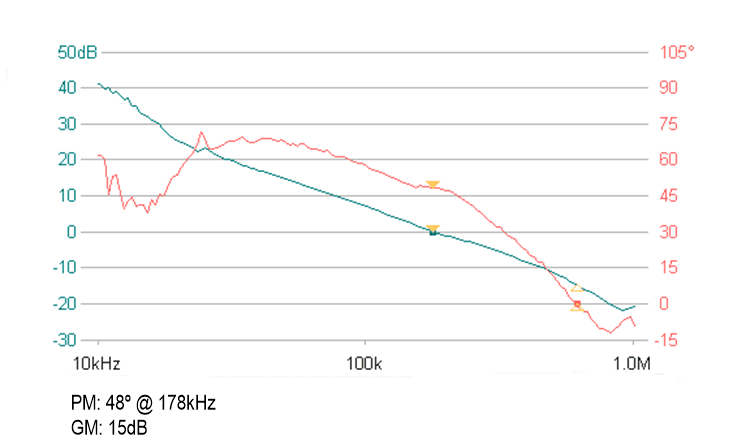 Figure 6-13 LP875761-Q1 Phase Margin /
Bode Plot at Vin = 3.3 V, -40°C