SPRADC9 july 2023 AM62A3 , AM62A7
5.1 System Accuracy
Several experiments were implemented to extensively test the accuracy of the entire system which includes the accuracy of both the yolox-nano-lite model, trained on the defect detection data, the object tracker, and the graphical dashboard. The experiments test the defect detection application live on testing samples (ring terminals). A collection of samples with predefined combination of classes (good, half ring, no plastic, and no ring) are placed the rotating table to simulate moving on a conveyor belt. The application is used to detect the samples and the results shown on the dashboard are compared with the actual statistics of the samples.
Table 5-1 shows the details of one experiment which includes a total of 50 samples with 20 % defected samples distributed as following: 3 half ring, 5 no plastic, and 2 no ring.
| Class | Ground Truth No. and [%] |
Application Results After 10 Rounds | Accuracy |
|---|---|---|---|
| Total Samples (Not a class) | 50 | 500 | NA |
| Good | 40 [80%] | 400 [80%] | 100 % |
| Half Ring | 3 [6%] | 30 [6%] | 100 % |
| No Plastic | 5 [10%] | 50 [10%] | 100 % |
| No Ring | 2 [ 4%] | 20 [4%] | 100 % |
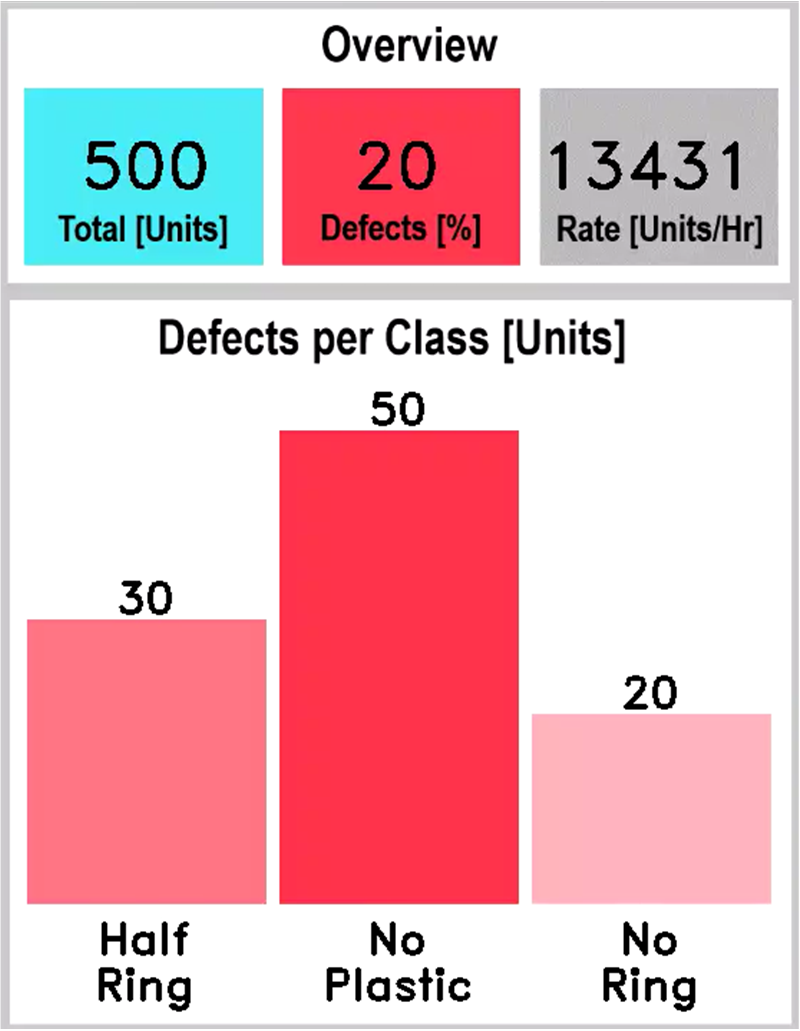
The samples are randomly placed on the rotating table and the application is used to detect them. The table with the samples were rotated for 10 rounds for repeatability assurance. Figure 5-1 shows the dashboard at the end of the tenth repeated tests. Comparing the results on the dashboard generated by the application with the ground truth input samples showed that the application successfully detected all good and defected units in all ten rounds as shown in Table 5-1.
 Figure 5-1 Dashboard Results of the
Accuracy Experiment With 50 Samples and 10 Repeated Tests (the defect detection
application achieved 100 % accuracy)