SPRADI0 July 2024
4.1 Processor-in-loop (PIL) Method
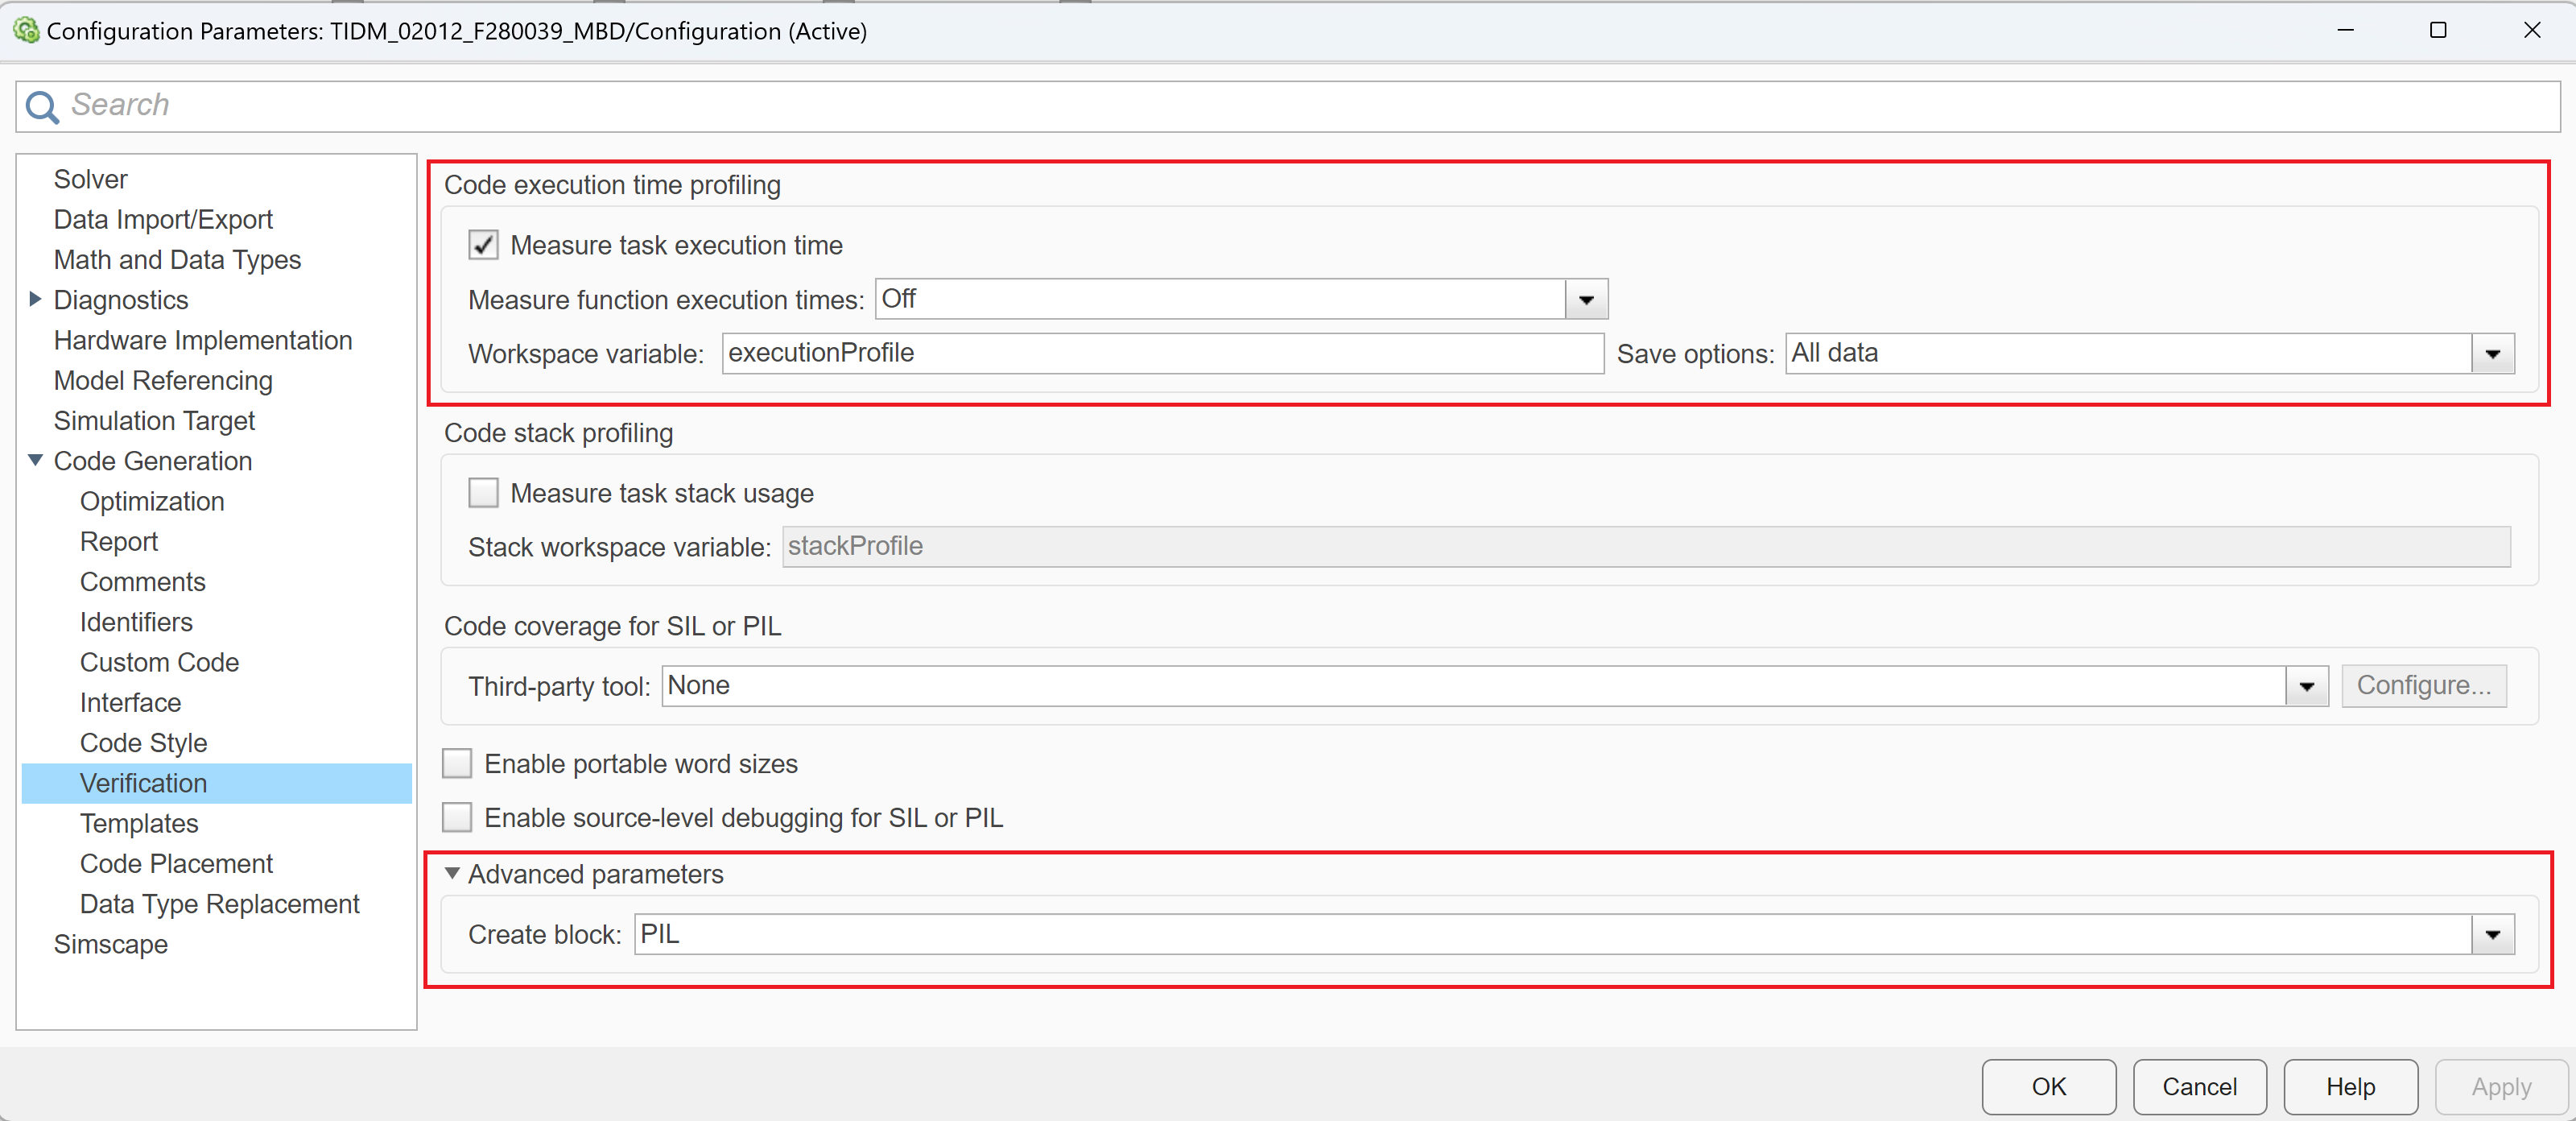
Simulink offers a processor-in-loop (PIL) simulation tool that allows to verify the code and profile it using the SIL/PIL manager tool. To profile using PIL tool, the hardware settings needs to be configured. Open hardware settings (Ctrl + E), go to Verification tab under Code Generation and enable Measure task execution time with settings as shown in Figure 4-1 and select PIL in the Create Block section under Advanced Parameters.
 Figure 4-1 Processor-in-loop
Profiling
Figure 4-1 Processor-in-loop
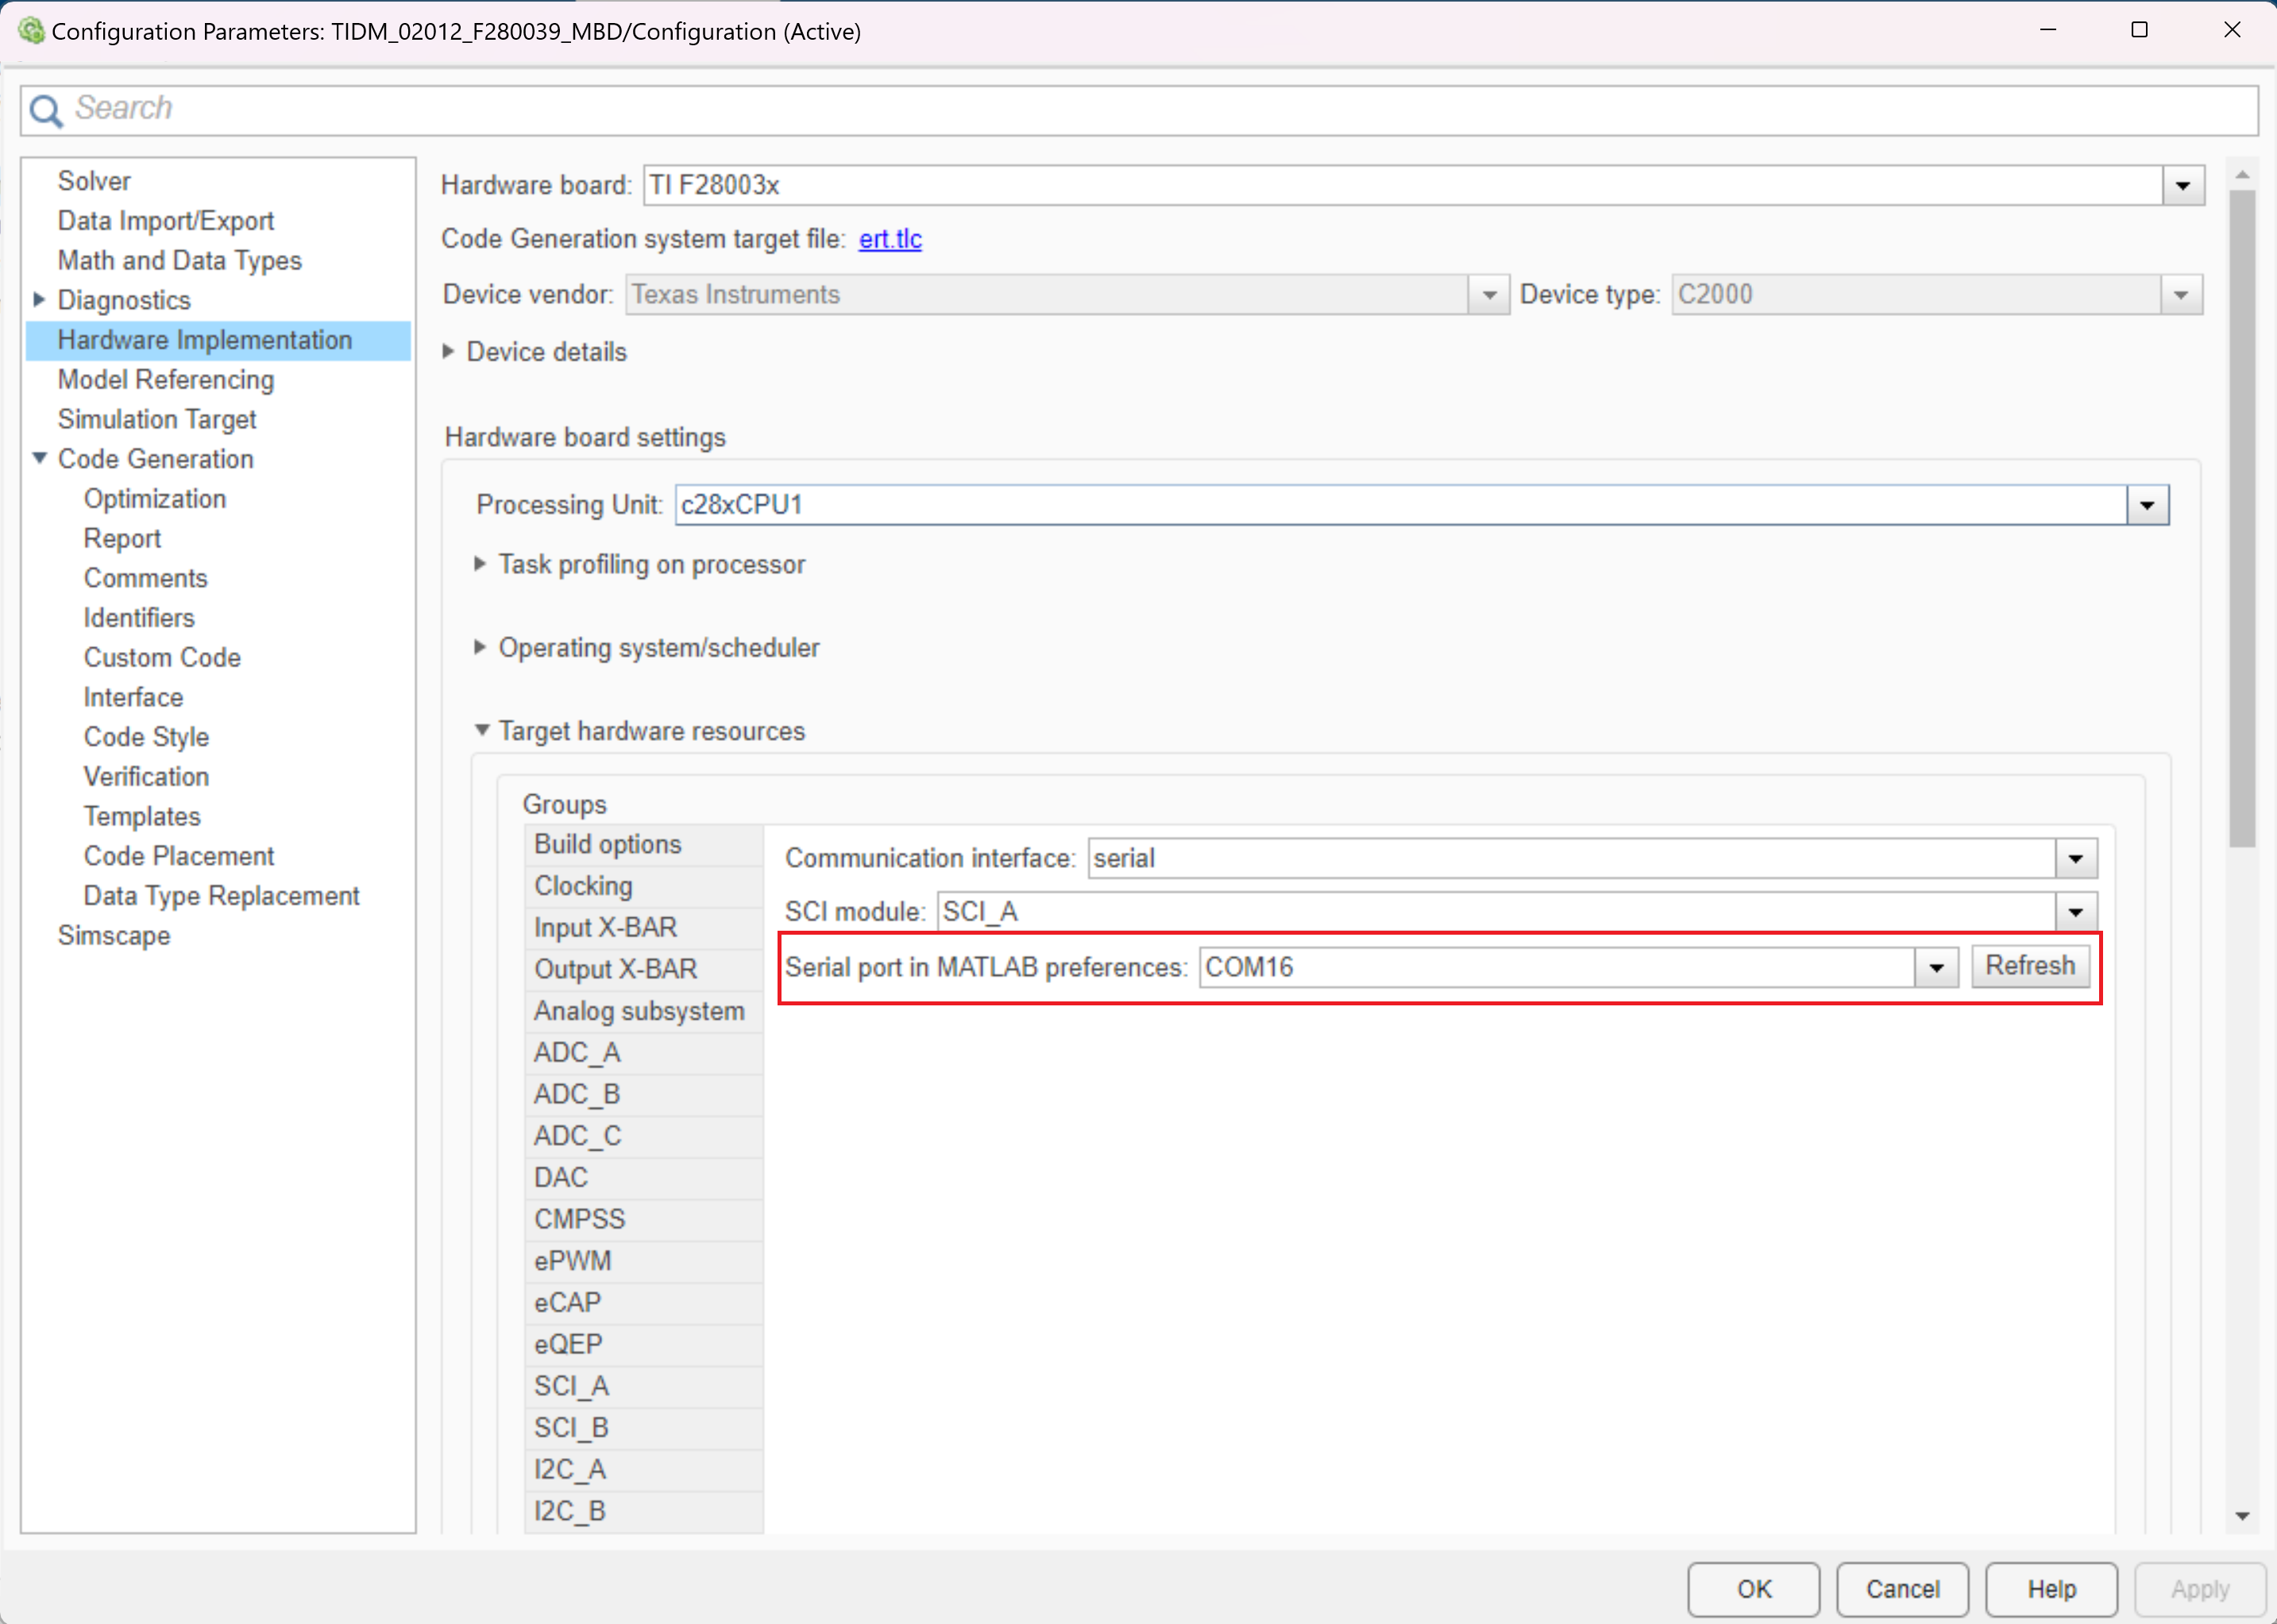
ProfilingConfigure the COM port in the PIL section in Target hardware resources under the Hardware Implementation tab as shown in Figure 4-2. Validate the serial port connection in MATLAB as per the device UART port.
To create a PIL block from a subsystem / system, right click the block to be chosen for profiling and select Deploy subsystem to hardware in C/C++ Code. This generates the code for the chosen block and generate a PIL block for the same. Replace the generated PIL block with the actual block. Open the SIL/PIL manager from the APPS tab. Select SIL/PIL Simulation Only as the mode, Model blocks in SIL/PIL mode as the System Under Test and give a reference stop time for the simulation before running the automated verification as shown in the Figure 4-2. Once the execution is successfully completed, the code execution parameters are available in a report available under the Results section in MATLAB. The report contains CPU utilization, execution time in nano-seconds (avg, min and max), which can be used to compute the cycle counts based on the device in use.
While the PIL is only used for profiling a single block of code, the C2000 timer and GPIO based profiling methods can be used to profile multiple blocks of code at a time. The advantage of PIL-based profiling is that the profiling data is clearly stated with respect to the rate of execution. If multiple loops are operating at different rates, PIL separates out the execution time for each of the blocks based on its rate of execution. The PIL-based method comes with a fixed small overhead in the measurement, hence it is recommended to use the PIL-based profiling method for profiling a block, which uses larger code size to minimize the effect of overhead.
 Figure 4-2 PIL COM Port
Configuration
 Figure 4-3 PIL Configuration
settings
Figure 4-3 PIL Configuration
settingsFor more information on PIL Simulation, see the PIL Simulation article.