SSZTCD1 august 2015
Thermal performance optimization for power management components seems very simple at first: just look at the data sheet, find the specs, add some margin and you’re done. But if you’re really trying to optimize for size, performance or cost, things can get complicated very quickly.
In my experience working with both device experts and system designers for power, I have found that this optimization process always breaks into five stages (shown in Figure 1) with four connections of data passing between them. You can skip some of them, but the five stages and four connections are always there.
 Figure 1 Flowchart of the Five
Stages
Figure 1 Flowchart of the Five
StagesInterestingly, an electronics system designer usually thinks from left to right, while a component supplier thinks from right to left.
The five stages are:
- System activity: How often is the component active, and at what power level? The answer is usually expressed in watts or amps, or perhaps as some percentage of a maximum value.
- Device current: How much current is actually flowing through the component during system activity? The answer is usually in expressed in milliamps or amps.
- Device power dissipation: As current flows, how much is dissipated as heat due to internal resistances and losses? The answer is usually expressed in milliwatts or watts.
- Device temperature: How much does the component heat up due to heat dissipation? The answer is usually expressed in degrees Celsius.
- Device reliability: How is the component’s lifetime reliability affected by high-temperature operation? The answer is usually expressed as failure in time (FIT), defined as one failure per 1 billion operational hours.
As I mentioned, there are four connections between these stages. Since each stage has different units, these connections are used for calculations which translate data to the units which are used in the previous or next stage.
- Usage profiles: How much current does the application require? This can look like curves of current drawn across various cycles, tables of usage levels as a percentage of lifetime or overall estimates such as 50,000 power-on hours at 85°C PCB temperature. These profiles can be typical, typical with margin added (such as 10%) or absolute worst case.
- Device efficiency: How much heat is dissipated (expressed as a percentage of power supplied)? For example, a device with 90% efficiency at 1V and 5A will dissipate approximately 500mW. You can look up some example data sheets for DC/DC converters here.
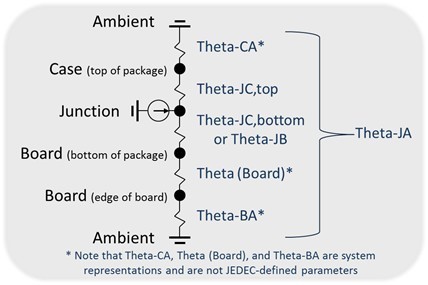
- Thermal parameters: How does the dissipated heat get out to the environment without overheating the components? Usually the component contributes 10-30%, and the PCB and environment contribute 70-90%. There are JEDEC-defined theta parameters to help, and many estimation methods are available. Figure 2 shows some common thermal parameters, and how they complete the heat flow path from junction to ambient.
- Reliability models: How will the component behave under time and temperature in the field? Higher temperature generally translates to a shorter lifetime, but how can you quantify it and see if the reliability requirements of your system can be achieved? The “bathtub curve” in Figure 3 is a common model, and you can find example devices and supporting documents in the search tool here.
 Figure 2 Common Thermal
Parameters
 Figure 3 Component Reliability “Bathtub
Curve”
Figure 3 Component Reliability “Bathtub
Curve”Additional Resources:
- Check out more detailed application notes at http://www.ti.com/thermal.
- Download a one-page reference sheet on thermal terms and methods.