SSZTCM1 june 2015
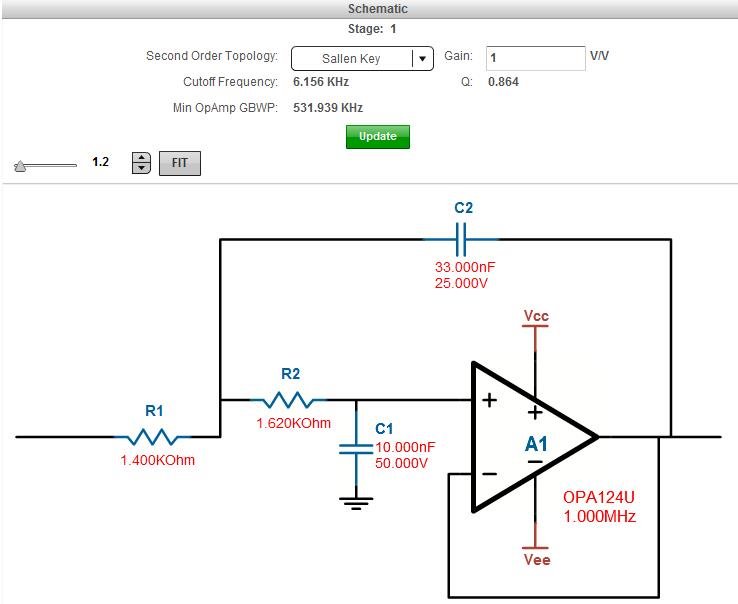
How do you anticipate ringing in the active analog filter of your operational amplifier (op amp)? The purpose of analog filters is to remove signal in an intentional frequency band, not to inadvertently add additional ringing into the signal path. Consider looking at the value of Q, or quality factor, of each filter stage. Figure 1 shows an example of the characteristics of a second-order low-pass Butterworth filter.
 Figure 1 Sallen-key, 6kHz Low-pass
Filter Using the WEBENCH® Filter Designer Tool
Figure 1 Sallen-key, 6kHz Low-pass
Filter Using the WEBENCH® Filter Designer ToolThe header in Figure 1 provides filter topology, gain, cut-off frequency, Q and the minimum op amp bandwidth, in this case for the OPA124 precision op amp.
These are all valuable entities when designing your filter, but let’s consider the Q in Figure 1, which is equal to 0.864. The value of Q is primarily dependent on the resistor and capacitor values in the circuit and relatively independent of the amplifier. This value of Q indicates that this system is underdamped. This unit-less variable actually quantifies the quality and amount of decay in the system. Q is related to ζ, the damping factor, by Q = 1/(2ζ). Each stage in multi-order filters generates its own Q factor.
If the maximum Q is less than 0.5, the system is overdamped. This type of system output does not ring at all. When the output voltage is displaced from its steady state, the filter’s output returns to its steady state with an exponential decay.
A Q value equal to 0.5 indicates that the system is critically damped. If you are designing a low- or high-pass filter, the first-order filters are the only filters that have a Q this low.
An underdamped circumstance occurs if Q is higher than 0.5. A Q greater than 0.5 indicates a lower rate of energy loss relative to the stored energy in the filter. At the output of these filter systems there will be a degree of ringing with input excitation. As the value of Q increases, it takes longer for the ringing to die out.
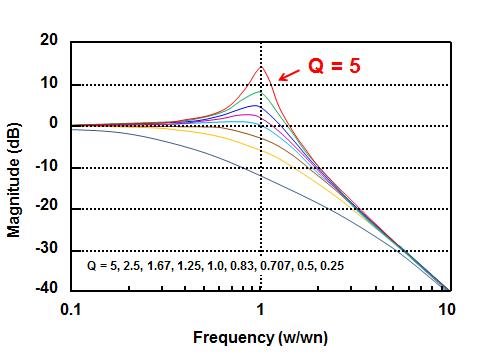
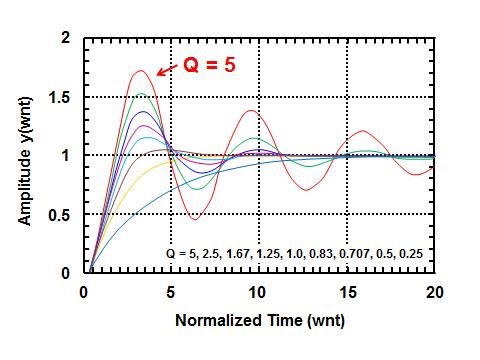
Figure 2 and Figure 3 compare the low-pass filter responses of different Q values with respect to the frequency-domain and time-domain characteristics.
 Figure 2 Impact of Q on the Frequency
Response of Low-pass Filters
  Figure 3 Unit-step Response with a Corner Frequency of 1Hz
The top plot in Figure 2 shows the level of filter gain overshoot versus frequency for various Q values. The combination of this gain/frequency response, combined with the impact on the phase margins, results in the ringing (Figure 3) that you see in your filter’s output.
The most dramatic effect of higher Q values is the settling time, as seen in Figure 3. The curve with a Q of 5 has considerable ringing compared to the Q with a curve of 0.707.
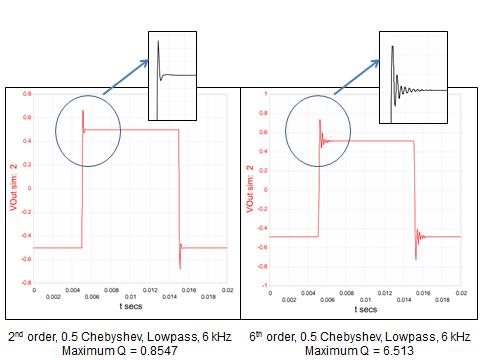
The two filter systems in Figure 4 have differing maximum Q values. The filter with a higher Q value demonstrates more ringing with a step stimulus at the input of the filter.
 Figure 4 Comparing the Step Response of
Second- and Sixth-order 0.5 Chebyshev Low-pass Filters
Figure 4 Comparing the Step Response of
Second- and Sixth-order 0.5 Chebyshev Low-pass FiltersIn Figure 4, the input signal for these filters is a 0.5V square wave. The maximum Q factor with the left-hand curve is 0.8547. The initial overshoot is approximately 0.15V above the final settling voltage value of 0.5V. This curve quickly settles to its final value with very little ringing.
The Q factor for Figure 4’s right-hand curve is equal to 6.513. The initial overshoot is approximately 0.23V overshoot. This curve, with a higher Q factor, takes a little longer to settle, with eight visible cycles. As you design filters you will find the maximum Q value for the particular filter you choose to design.
So how high can Q become before it causes problems? In our industry, the consensus is that Q should be less than 10. But, beyond that, assess the characteristics and requirements of your circuit. From there, you can decide what is the maximum acceptable Q for your system.
Additional Resources
- “Q – Quality Factor Tutorial” from Radio-Electronics.com.