SWRA730 February 2022 CC1311P3 , CC1311R3 , CC1312R , CC1312R7 , CC1314R10 , CC1352P , CC1352P7 , CC1352R , CC1354P10 , CC1354R10
- Trademarks
- Acronyms
- 1Description of the PCB Antenna
- 2Test Setup
- 3Unmatched Results
- 4Single-Band Matching and Result
-
5Dual Band Matching and Results
- 5.1 433-MHz and 2440-MHz Smith Chart, SWR, Bandwidth, and Efficiency
- 5.2 470-MHz and 2440-MHz Smith Chart, SWR, Bandwidth and Efficiency
- 5.3 490 MHz and 2440 MHz Smith Chart, SWR, Bandwidth and Efficiency
- 5.4 510-MHz and 2440-MHz Smith Chart, SWR, Bandwidth, and Efficiency
- 5.5 868/915 and 2440-MHz Smith Chart, SWR, Bandwidth, and Efficiency
- 6Summary - Bill of Materials and Results
- 7Conclusion
- 8References
4.1 433-MHz Smith chart, SWR, Bandwidth, and Efficiency
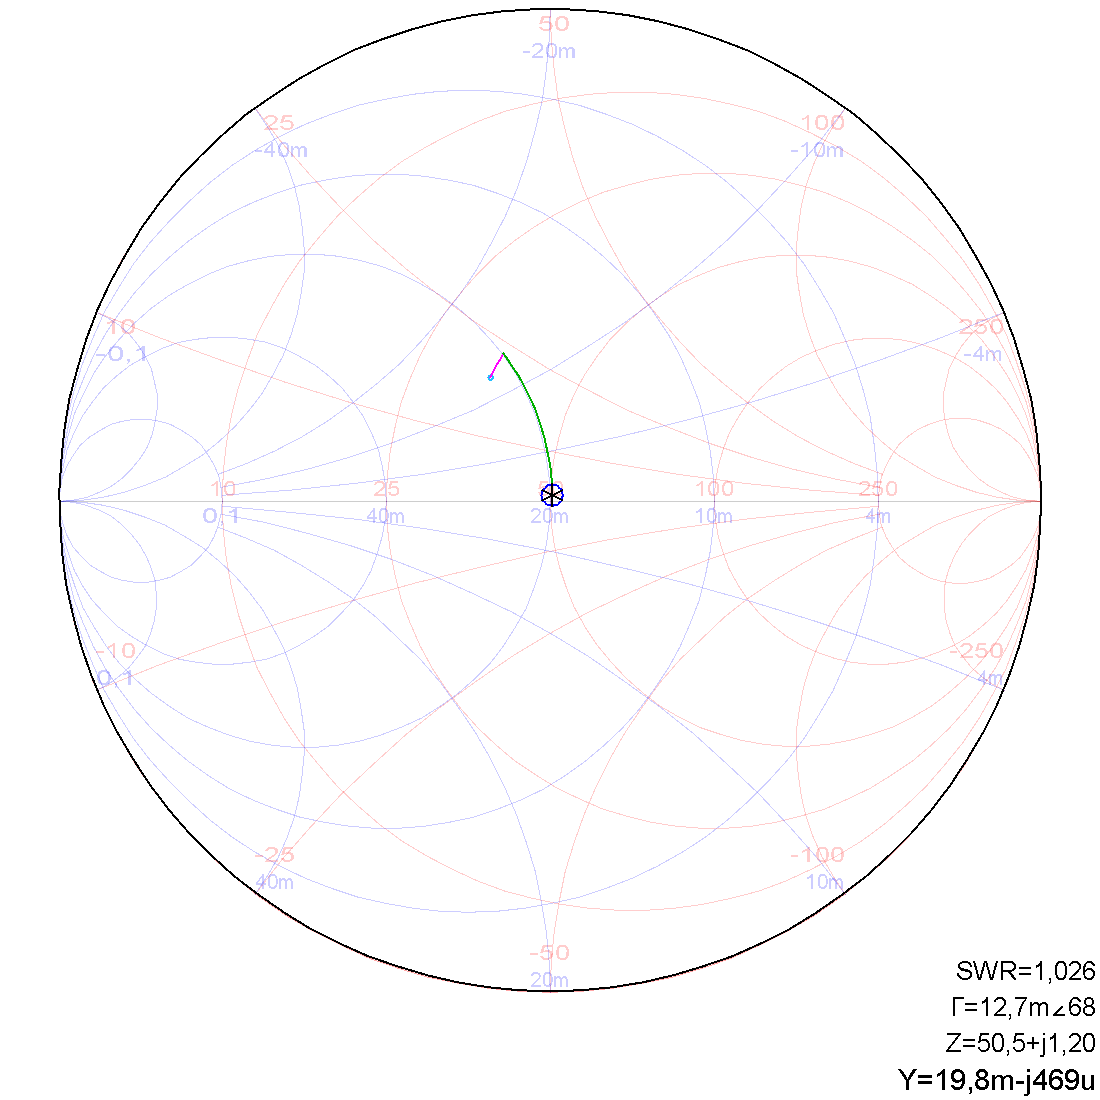
Figure 4-1 shows the theoretical Smith chart for matching the antenna for single-band 433 MHz with a theoretical SWR of 1.026.
 Figure 4-1 Theoretical Smith Chart for Single-Band 433-MHz Matching
Further tuning of the resonance of the antenna was needed after realizing the theoretical match. Figure 4-2 and Figure 4-3 shows the resulting impedance and SWR which at 1.05 is less than the threshold for a good match of SWR < 2.0. Table 4-1 shows the BOM with components used to relies the matching network given in Figure 1-2.
The bandwidth of the antenna defined by SWR < 2.0 can be seen in Figure 4-3 to be 444.78-422 = 22.78 MHz.
| Ref. Designator | Murata Part Number | Value |
|---|---|---|
| Z60 | 0 Ω | |
| Z61 | DNM | |
| Z62 | GRM0335C1H4R3CA01 | 4.7 pF |
| Z63 | LQP03TN2N0B02 | 2 nH |
| Z64 | LQP03TN51NH02 | 51 nH |
Figure 4-4 shows the radiation pattern of the antenna matched for 433 MHz radiating at 13 dBm 433 MHz. The figure shows a TRP of 5.25 dBm, this with a measured conducted output power of 12.42 dBm gives us an efficiency of 19.19%.