SWRA820A May 2024 – August 2024 AWRL6432AOP , IWRL6432AOP
2 Increased Receiver Noise Figure
The noise riding on the coupled signal can increase the noise figure of the receiver. Increased noise figure reduces the SNR of the detected object, leading to reduced detection range and accuracy. The effective isotropic noise figure therefore depends on two things:
- TX Backoff
- TX - RX Isolation
The TX - RX isolation depends on two factors:
- Transmit and Receive combination
- RF frequency
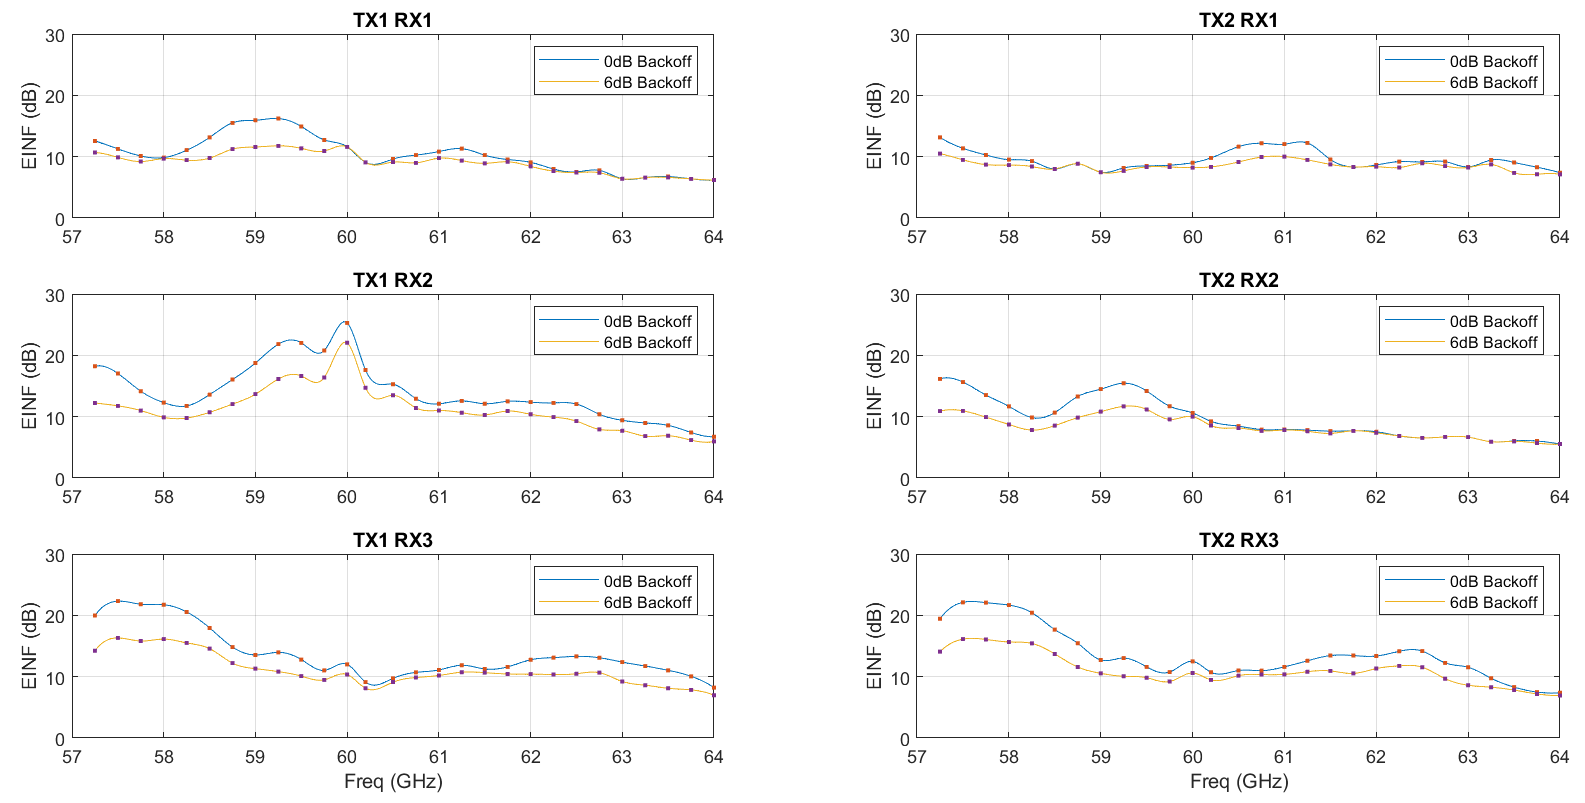
Figure 2-1 shows the dependencies of the effective isotropic noise figure (EINF) across different transmit and receive combinations and across different RF frequencies. The EINF is shown for two different TX backoff settings (0dB and 6dB). The change in noise figure between the two TX backoff settings show the impact of TX-RX coupling on noise figure for different RF frequencies.
 Figure 2-1 EINF With Single TX on Across
Frequencies
Figure 2-1 EINF With Single TX on Across
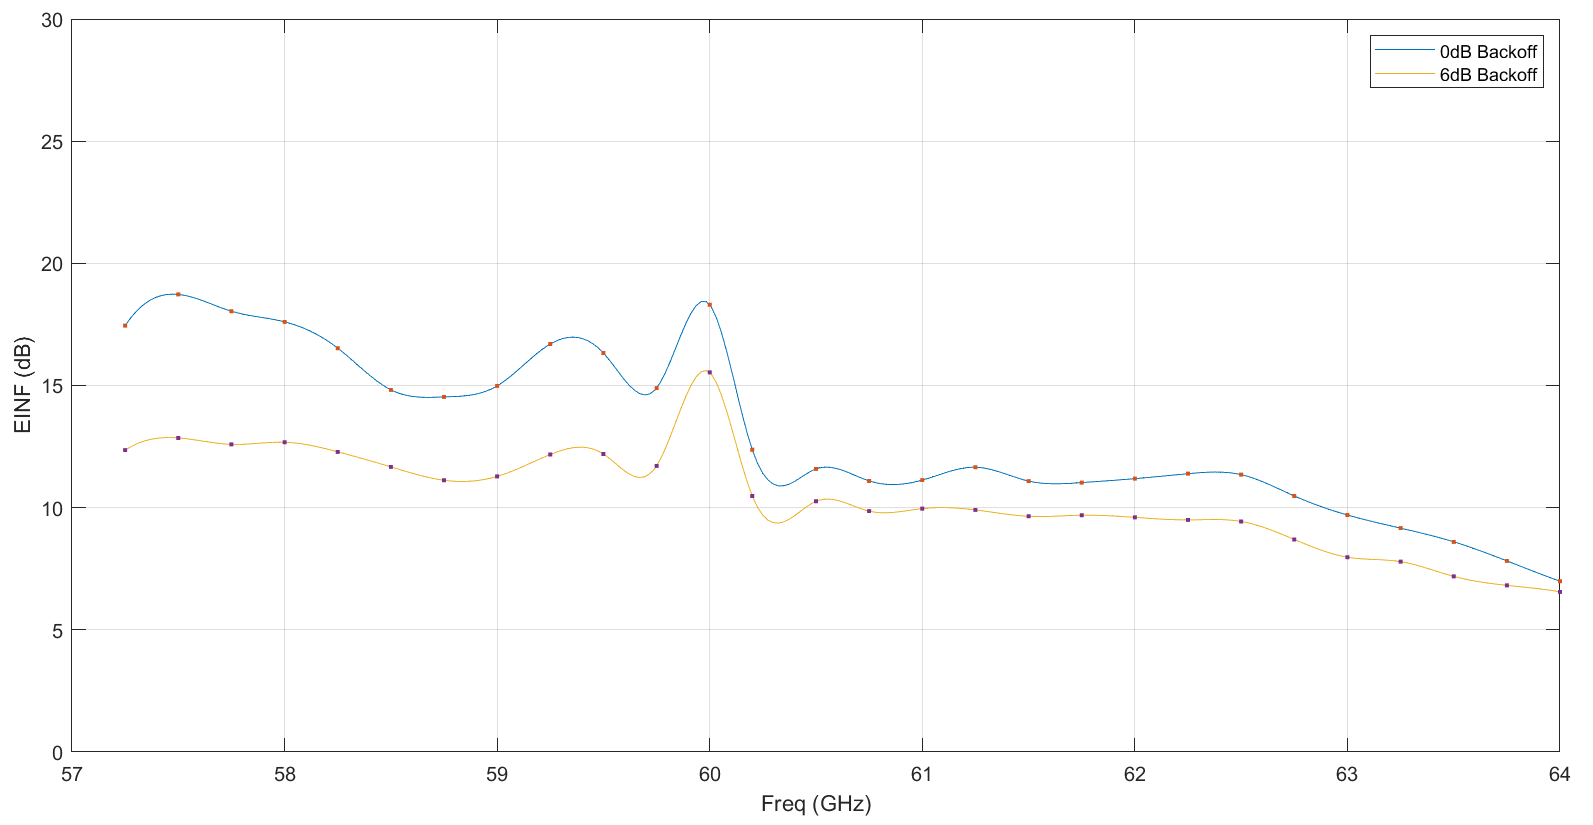
FrequenciesThese effects across transmit and receive pairs can be combined to show a total effect of all transmit and receive antennas across RF frequency. Figure 2-2 shows the noise figure averaged across different TX-RX combinations.
 Figure 2-2 Average EINF With Single TX on
Across Frequencies
Figure 2-2 Average EINF With Single TX on
Across Frequencies(< 0.5GHz) around 60GHz.
Maximizing detection range (or minimizing required integration time for a particular detection distance) relies on maximizing detection SNR. Based on the previously-mentioned noise figure profiles, this can be achieved in several ways.
- Reducing TX power (increasing power backoff) lowers the noise figure by reducing the amount of coupling between TX and RX antennas. This varies between TX and RX combination and across output frequency. However, the benefit by lowered noise figure is outweighed by the reduction in transmitted power, lowering the detection range.
- Choosing start and stop frequencies (bandwidth) of the FMCW chirp can help reduce coupling and lower the noise figure. As Figure 2-2 shows, the 61 to 64GHz band has lower coupling than the 57 to 61GHz band. Designing a chirp to utilize the 61 to 64GHz portion of the frequency band can help lower the noise figure. Local regulations and other considerations can drive frequency choice of the end application, but the previous graphs can be used for expected noise figure in different frequency bands.
- For applications which do not need all 6 virtual channels (TX and RX combinations), using TX2 can help reduce noise figure. The coupling is lowest for TX2 in the 59 to 64GHz band. For single TX applications need, use TX2 over TX1 to get best performance and maximum range.
- For two TX applications, use TDM MIMO mode instead of BPM MIMO mode.