TIDT012 February 2022
3.2 Output Voltage Ripple
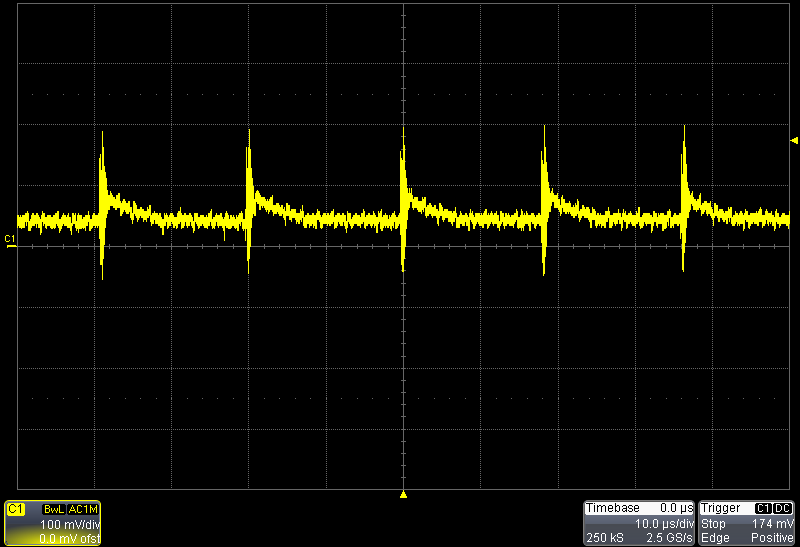
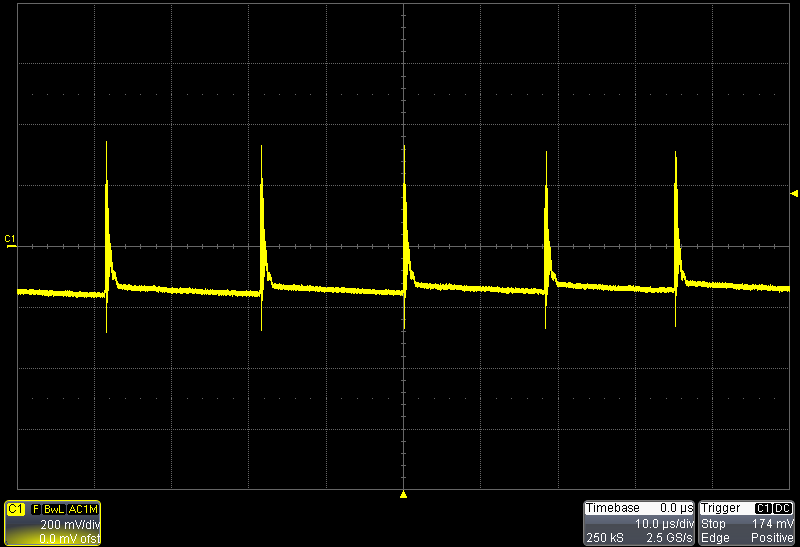
Figure 3-4 and Figure 3-5 show the output voltage ripple. Measurements were taken using the tip and barrel method across a small ceramic capacitor by the output connector. The input was set to 120-VAC for all tests.
 Figure 3-4 Output Voltage Ripple on
12-V Output
 Figure 3-5 Output Voltage Ripple on
24-V Output