TIDT205 February 2021
3.5 Bode Plots
Bode plots are shown in the following figures.

VIN = 13.5 V, VOUT = 5 V,
with a 2.43-A load current.
Phase Margin: 93.037 degrees, Gain Margin: –27.454 dB
Figure 3-12 5-V Rail Bode Plot (VIN = 13.5 V, IOUT = 2.43 A). Phase Margin: 93.037 degrees, Gain Margin: –27.454 dB

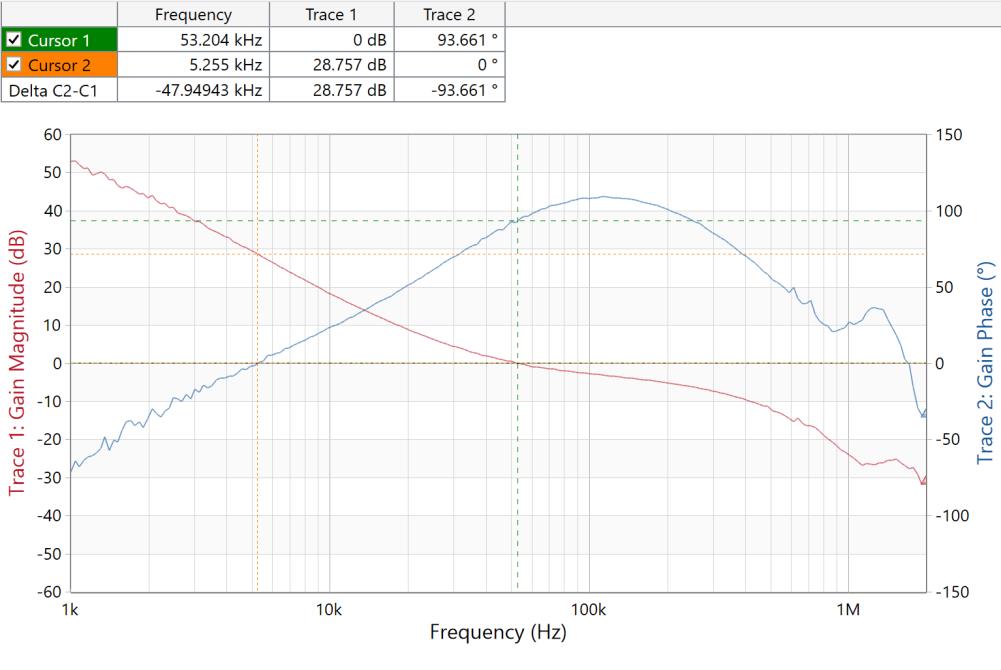
VIN = 5 V, VOUT = 3.3 V,
with a 0.18-A load current.
Phase Margin: 93.661 degrees, Gain Margin: –28.757 dB
Figure 3-13 3.3-V Rail Bode Plot (VIN = 5 V, IOUT = 0.18 A). Phase Margin: 93.661 degrees, Gain Margin: –28.757 dB

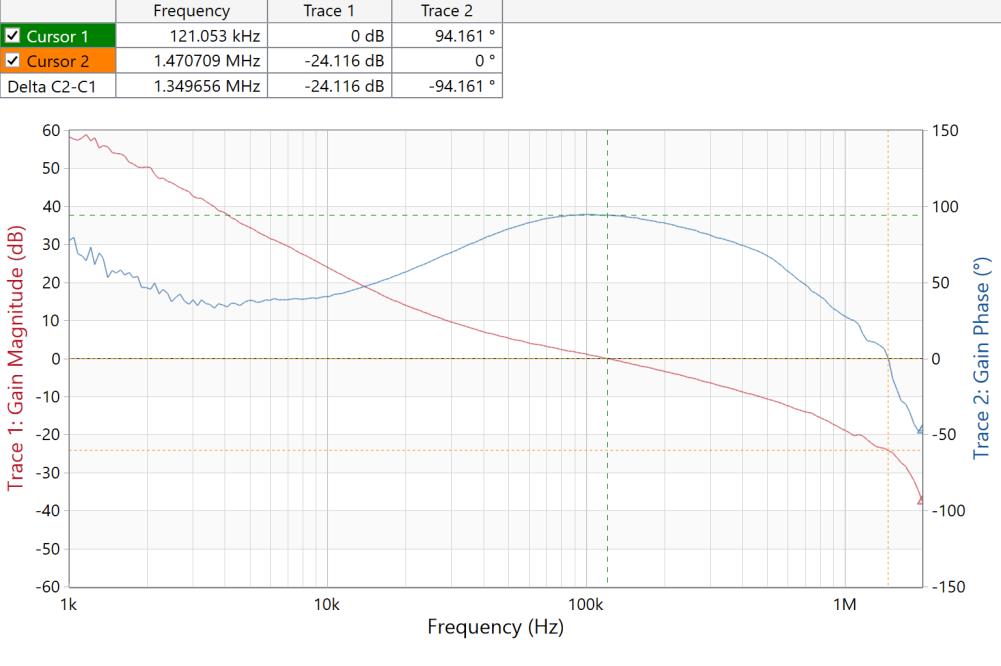
VIN = 5 V, VOUT = 1.8
V, with a 0.28-A load current.
Phase Margin: 94.161 degrees, Gain Margin: 24.116 dB
Figure 3-14 1.8-V Rail Bode Plot (VIN
= 5 V, IOUT = 0.28 A). Phase Margin: 94.161 degrees, Gain Margin: 24.116 dB

VIN = 5 V, VOUT = 1.35
V, with a 0.22-A load current.
Phase Margin: 83.759 degrees, Gain Margin: 21.223 dB
Figure 3-15 1.35-V Rail Bode Plot
(VIN = 5 V, IOUT = 0.18 A). Phase Margin: 83.759 degrees, Gain Margin: 21.223 dB

VIN = 5 V, VOUT =
1.175 V, with a 2-A load current.
Phase Margin: 80.544 degrees, Gain Margin: 24.283 dB
Figure 3-16 1.175-V Rail Bode Plot
(VIN = 5 V, IOUT = 2 A). Phase Margin: 80.544 degrees, Gain Margin: 24.283 dB