TIDT213 March   2023


  1.   Description
  2.   Features
  3.   Applications
  4. 1Efficiency and Power Factor
    1. 1.1 Graph Results
  5. 2Thermal Images
    1. 2.1 Thermal Test With Natural Convection (120 VAC, 60 Hz, 384 V at 1.88-A Output)
    2. 2.2 Thermal Test With Forced Air Flow (120 VAC, 60 Hz, 385 V at 2.6-A Output)
    3. 2.3 Thermal Test With Natural Convection (230 VAC, 50 Hz, 385 V at 2.6-A output)
  6. 3Start-up
  7. 4Turn-off
  8. 5Output Voltage Ripple
  9. 6Transient Response
  10. 7Key Waveform
  11. 8Conducted Emission

Turn-off

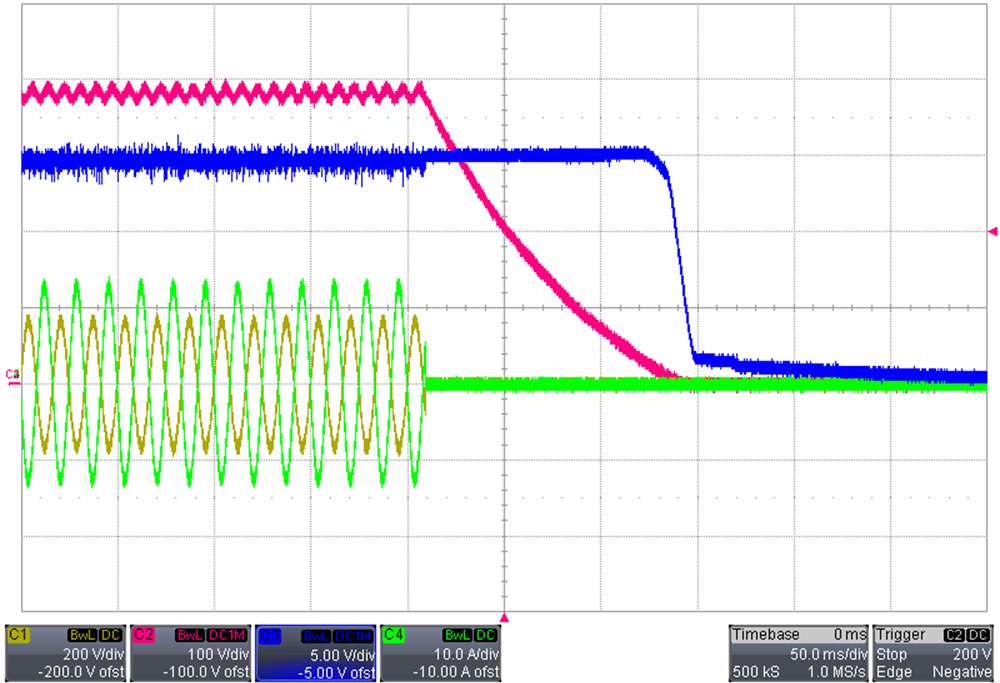
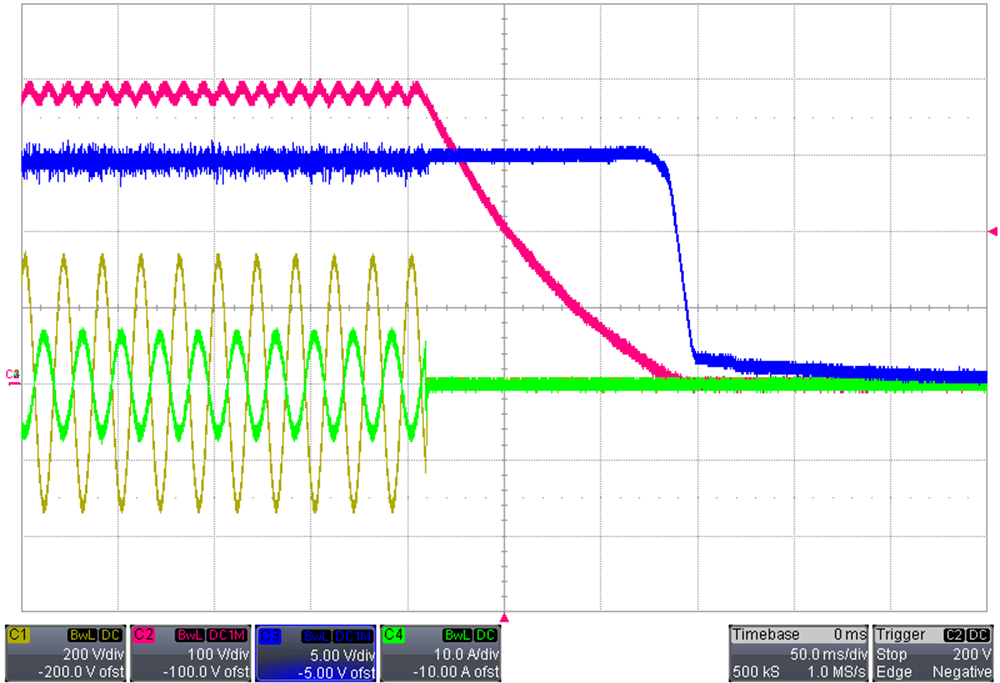
The voltage and current at turn-off are illustrated in the following images.
GUID-20201230-CA0I-V2NJ-ZVHJ-DTPF9CGTXGFL-low.png
C1 = VIN, C2 = VOUT, C3 = 15-V Bias, C4 = IIN
Figure 4-1 120 VAC, 60 Hz – Full Load on J100
GUID-20201230-CA0I-ZJNJ-CKW3-6X4XCXM5PD2F-low.png
C1 = VIN, C2 = VOUT, C3 = 15-V Bias, C4 = IIN
Figure 4-2 230 VAC, 50 Hz – Full Load on J100