TIDT222 April 2021
3.3 Thermal Images
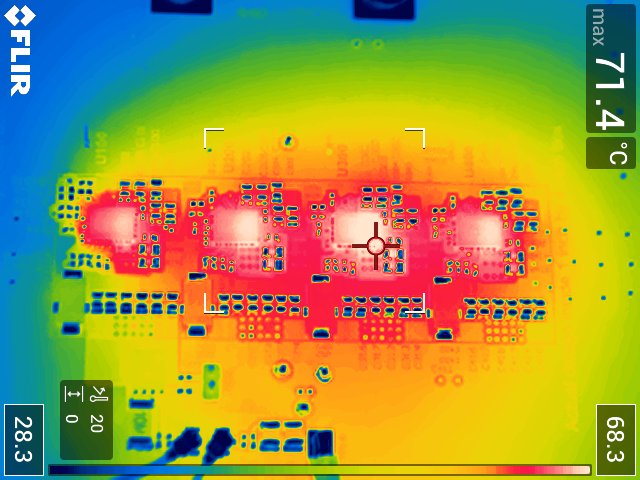
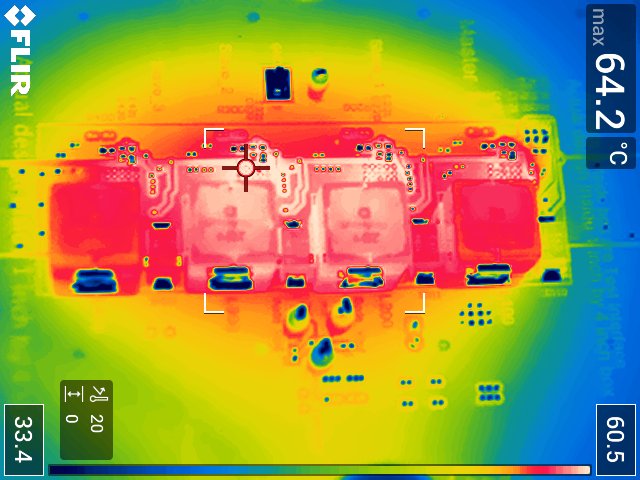
The following thermal image shows operation at 12-V input and 1.2- V at 100-A output, with no airflow. The board ran for 20 minutes with these conditions before the thermal image was taken.
 Figure 3-3 100-A Output, No Airflow - Side With Converters
 Figure 3-4 100-A Output, No Airflow - Side With Inductors
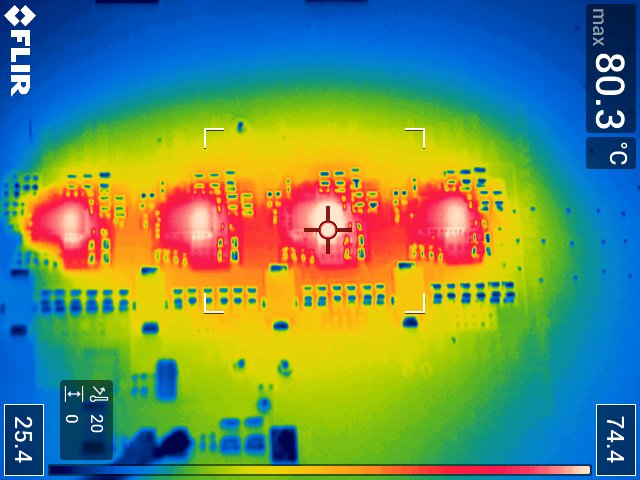
 Figure 3-5 160-A Output, 1–2 mps
Airflow - Side With Converters
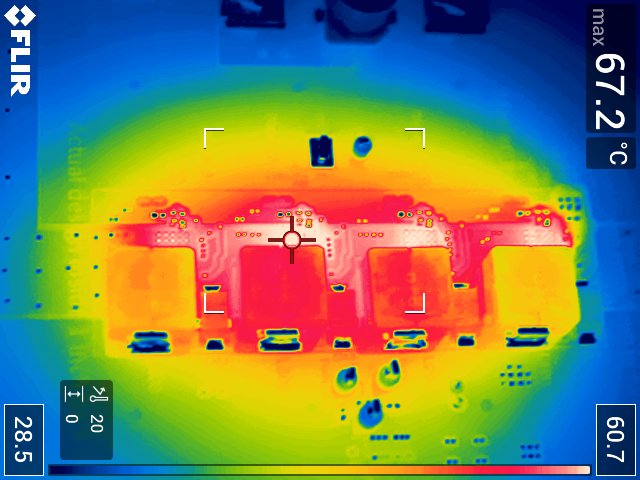
 Figure 3-6 160-A Output, 1–2 mps
Airflow - Side With Inductors