TIDT252 December 2021
2.1 Efficiency Graphs
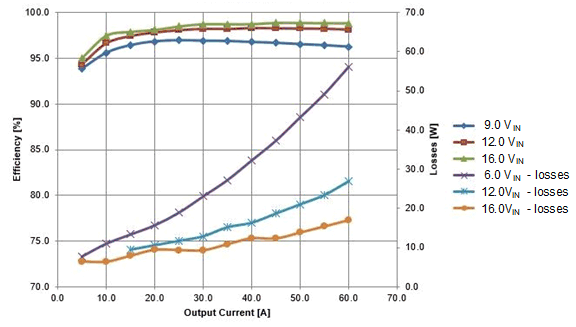
Efficiency and losses are shown in the following figure.
 Figure 2-1 Efficiency and Losses
Graphs at 9.0 VIN, 12.0 VIN and 16.0
VIN
Figure 2-1 Efficiency and Losses
Graphs at 9.0 VIN, 12.0 VIN and 16.0
VINTIDT252 December 2021
Efficiency and losses are shown in the following figure.
 Figure 2-1 Efficiency and Losses
Graphs at 9.0 VIN, 12.0 VIN and 16.0
VIN