TIDT260 March 2022
2.1 Efficiency Graphs
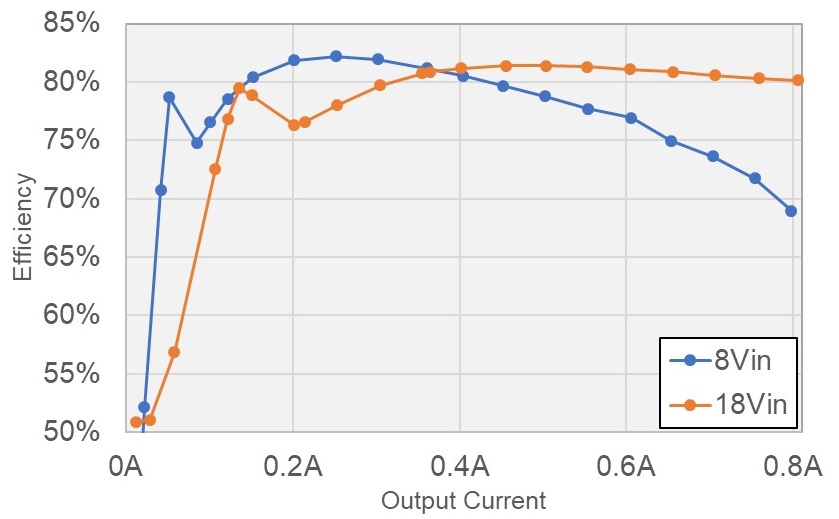
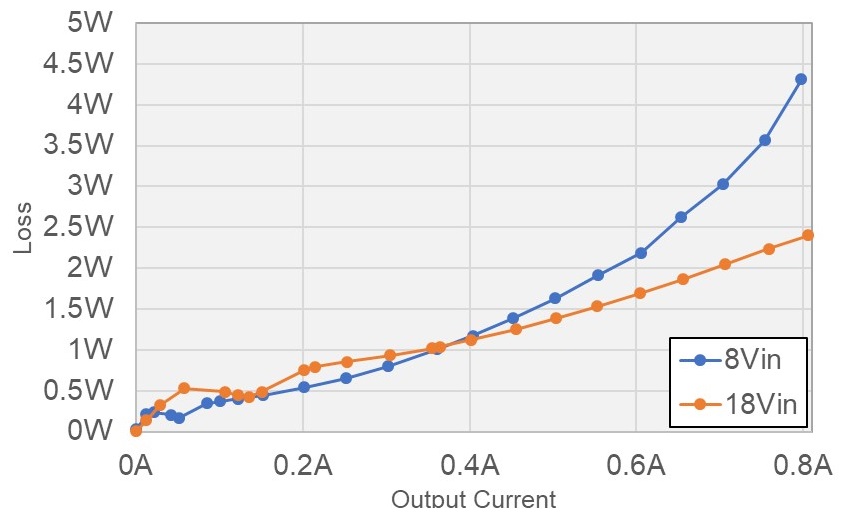
Figure 2-1 shows the efficiency graph and Figure 2-2 shows the loss graph.
 Figure 2-1 Efficiency Graph
 Figure 2-2 Loss Graph
TIDT260 March 2022
Figure 2-1 shows the efficiency graph and Figure 2-2 shows the loss graph.
 Figure 2-1 Efficiency Graph
 Figure 2-2 Loss Graph