TIDT260 March 2022
2.3 Line Regulation
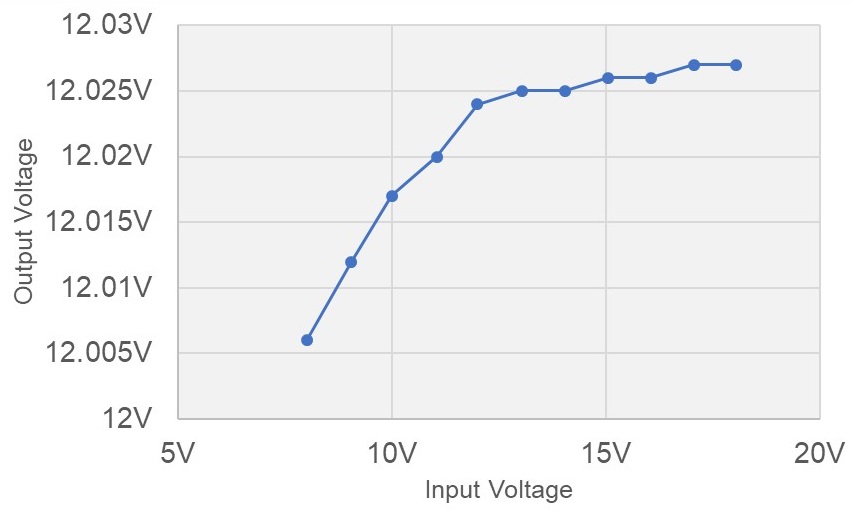
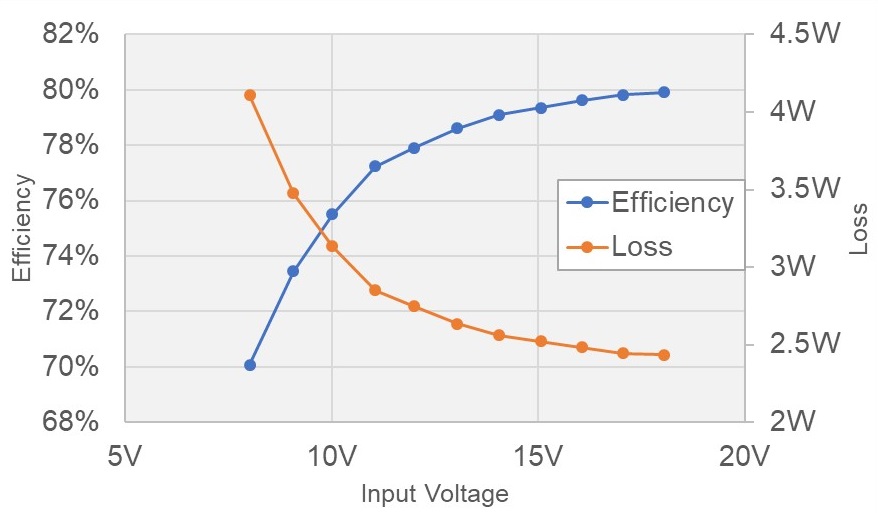
Figure 2-4 shows the line regulation output versus input voltage graph. Figure 2-5 shows the input voltage versus full load efficiency and loss graph.
 Figure 2-4 Output Voltage vs Input
Voltage
 Figure 2-5 Efficiency and Loss vs Input
Voltage