TIDT261 March 2022
2.5 Bode Plots
Figure 2-12 through Figure 2-16 show the PMP31114 bode plots.
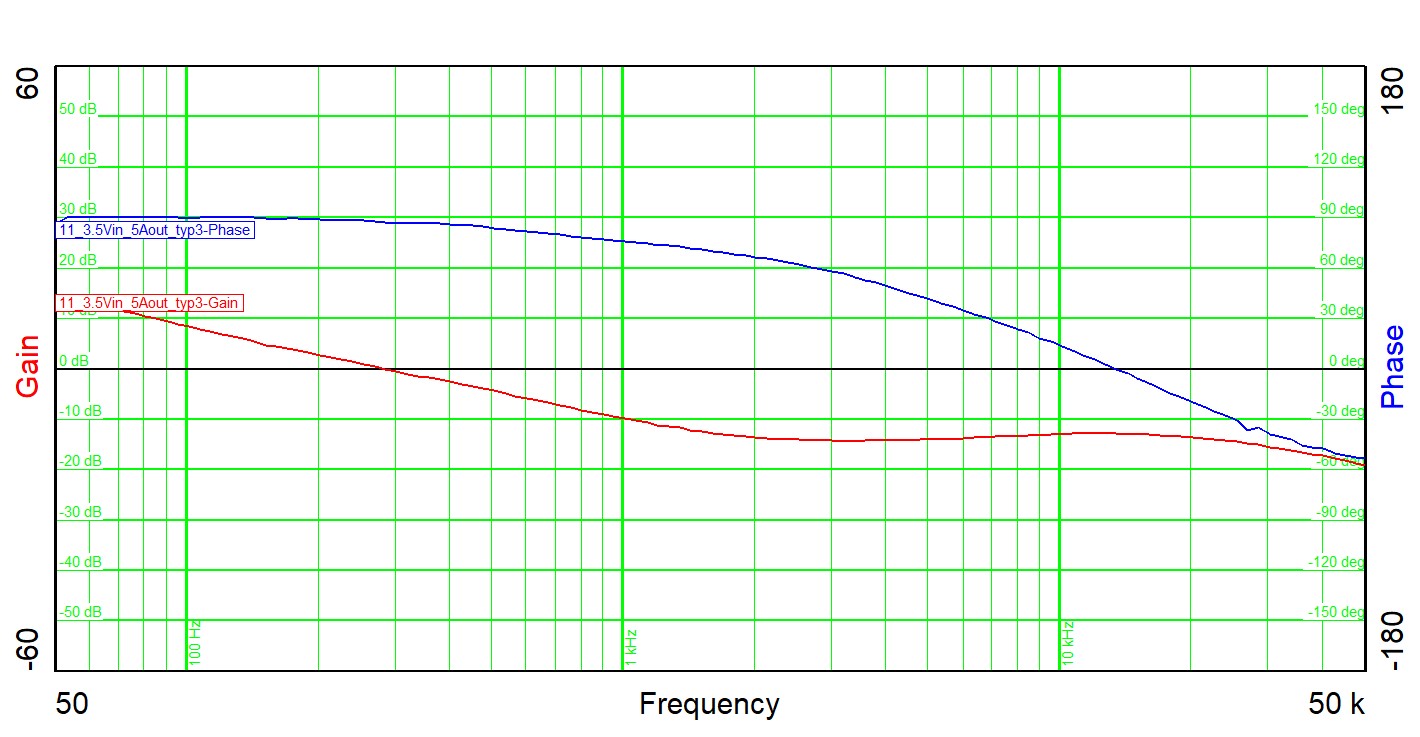 Figure 2-12 Bode Plot at 3.5-V Input Voltage
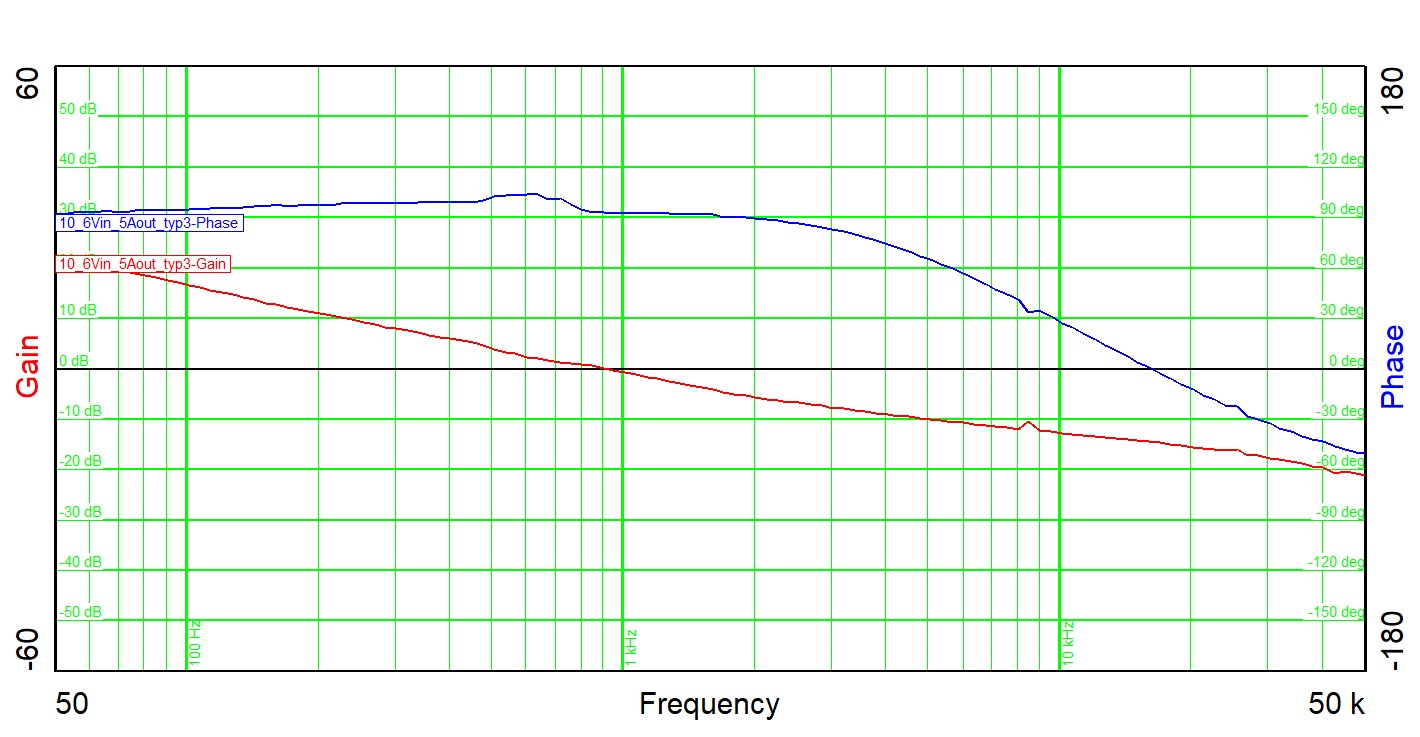 Figure 2-13 Bode Plot at 6-V Input Voltage
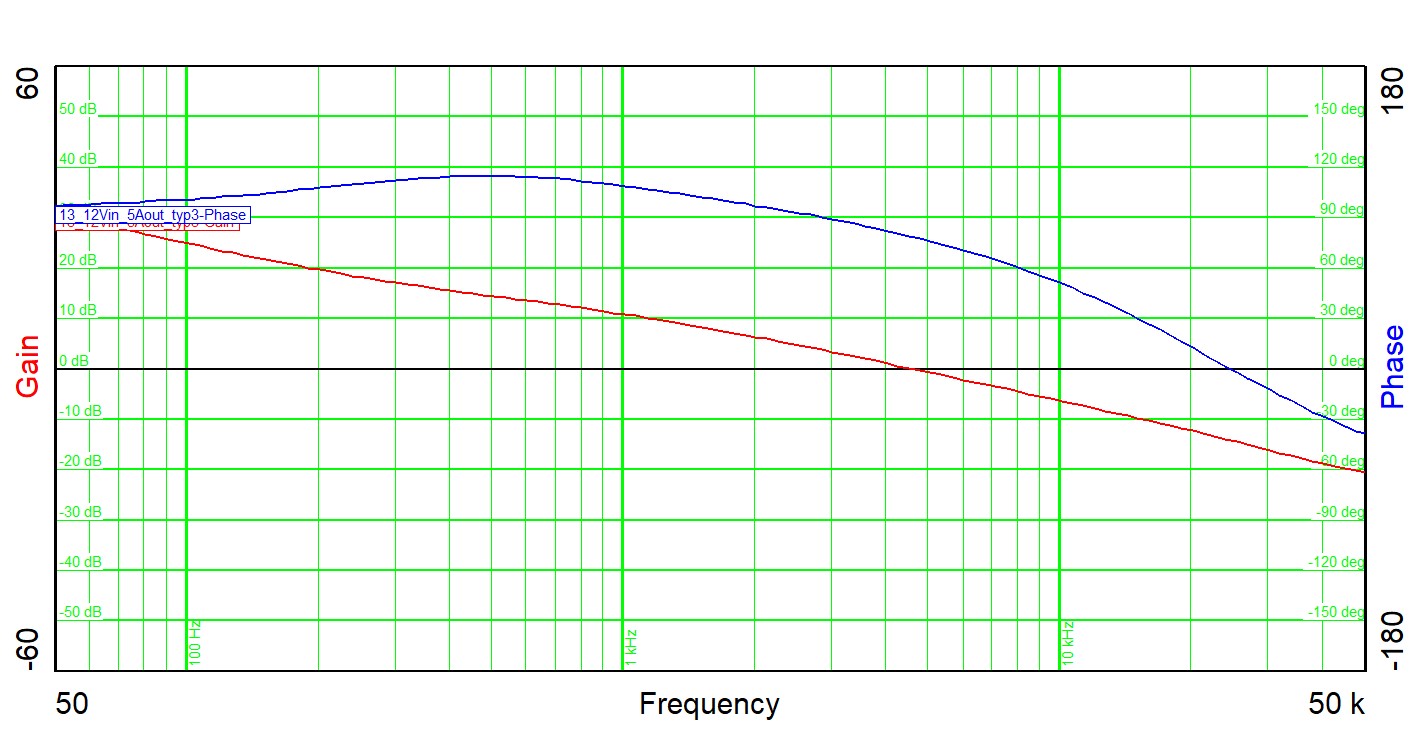 Figure 2-14 Bode Plot at 12-V Input Voltage
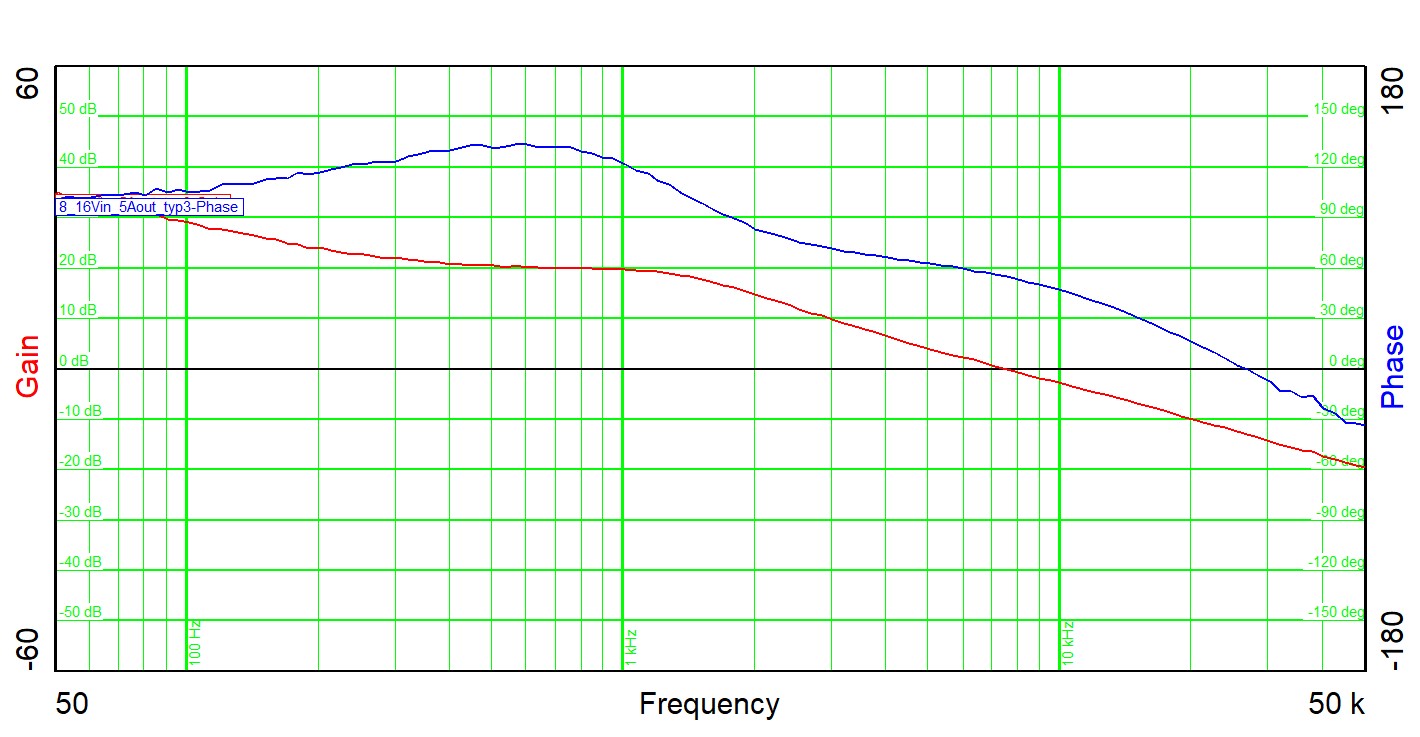 Figure 2-15 Bode Plot at 16-V Input Voltage
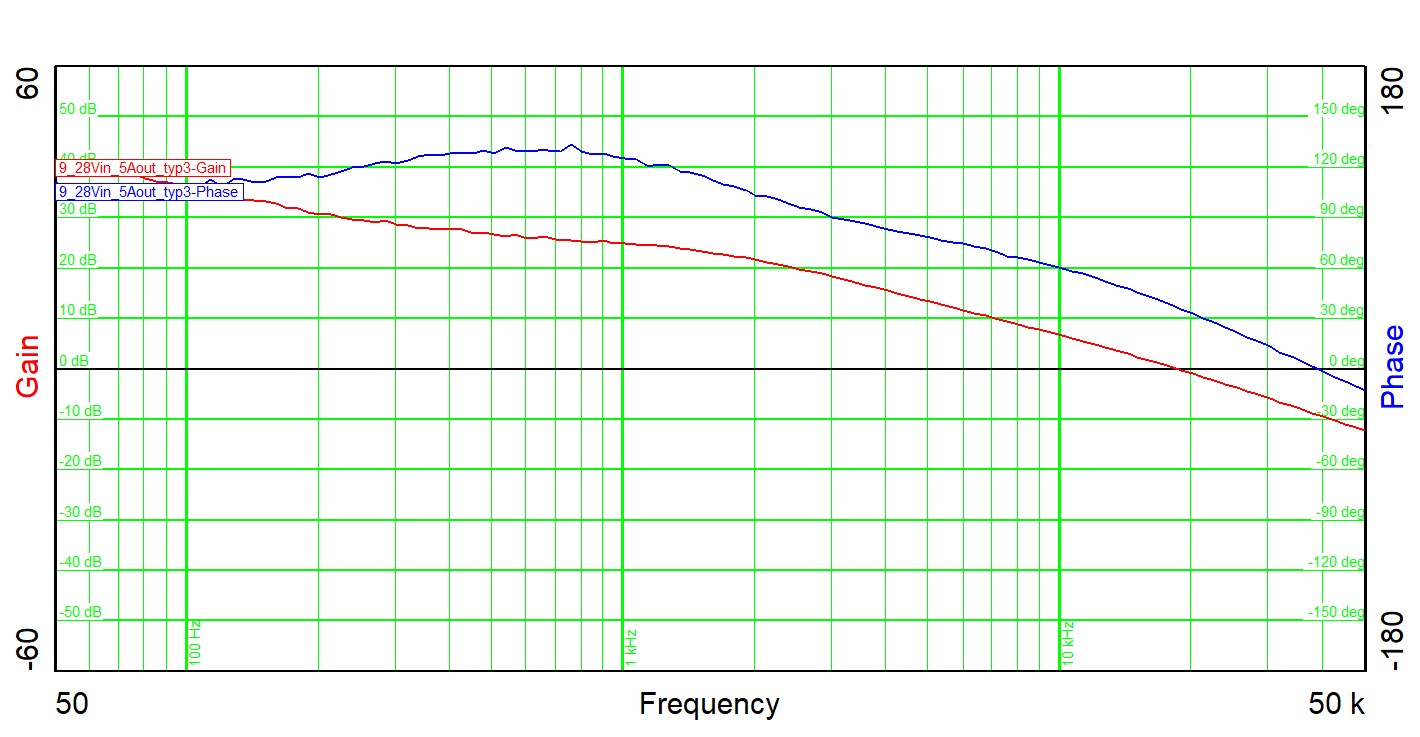 Figure 2-16 Bode Plot at 28-V Input Voltage
Table 2-1 details a summary of the test results from the bode plots.
Table 2-1 Summary of the Bode Plots
Test Results
| VIN | 3.5 V | 6 V | 12 V | 16 V | 28 V |
|---|---|---|---|---|---|
| Bandwidth (Hz) | 281 | 913 | 4581 | 7427 | 18620 |
| Phase Margin | 87° | 93° | 78.7 | 55.3 | 36.6 |
| Slope (20 dB / decade) | –0.93 | –0.86 | –0.91 | –1.1 | –1.3 |
| Gain Margin (dB) | –13 | –14.6 | –14.2 | –12.9 | –9.1 |
| Slope (20 dB/decade) | –0.06 | –0.474 | –1 | –1.4 | –1.4 |
| Frequency (kHz) | 13.4 | 16.3 | 24.6 | 26.5 | 38.9 |