TIDT279 October 2022
2.1 Efficiency and Loss Graphs
Figure 2-1 through Figure 2-3 show the PMP23194 efficiency graphs for 3.3 V, 5 V and 8 V, respectively.
For the main 3.3 V with 22-W maximum output power, efficiency peaks at 95% at 10 VIN, just over 93% for 14 VIN, and about 91.5% for 18 VIN. For the lowest power 5 V with 0.6-W maximum output power, efficiency is in the 70%–80% range at 14 VIN and loading above 50% maximum load. For the 8 V with 4.8-W maximum output power, efficiency is in the 80%–86% range for loads at and above 2 W at all three input voltages tested.
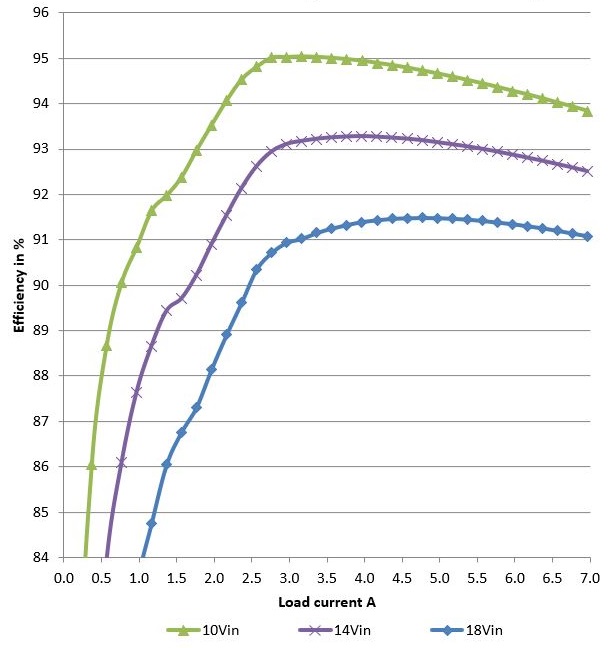 Figure 2-1 PMP23194 3.3-V DC/DC Converter Efficiency
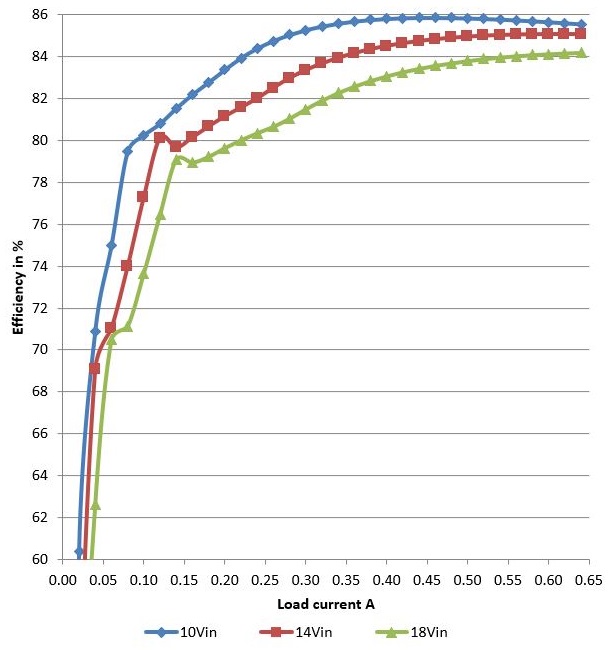 Figure 2-3 PMP23194 8-V DC/DC Converter Efficiency
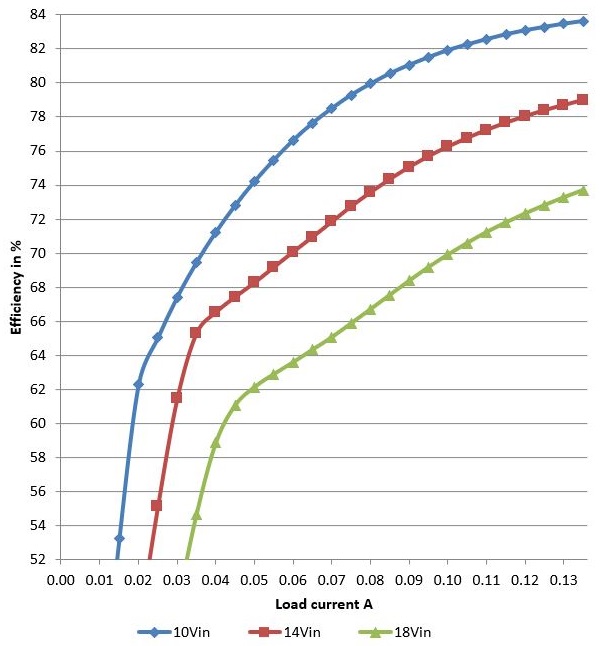 Figure 2-2 PMP23194 5-V DC/DC Converter Efficiency
Figure 2-4 through Figure 2-6 show the loss graphs for 3.3 V, 5 V and 8 V, respectively. These loss graphs for all three outputs are shown from no load thru maximum load at the same input voltages. Losses in input EMI filters are not included here.
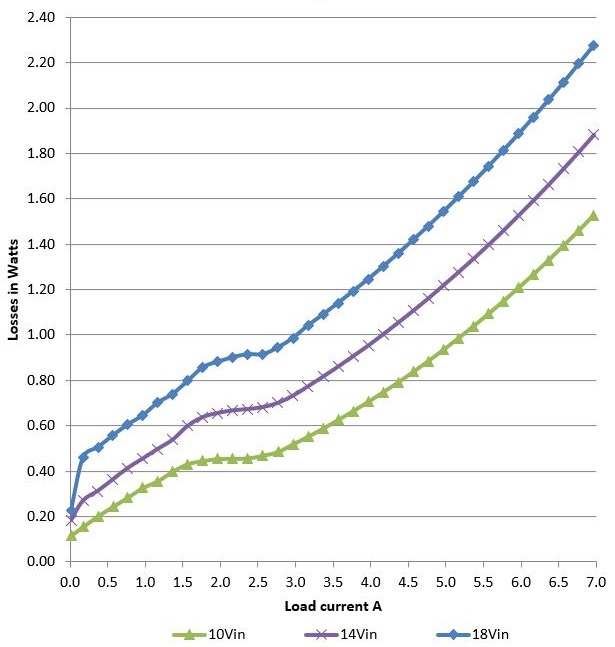 Figure 2-4 PMP23194 3.3-V DC/DC Converter Losses
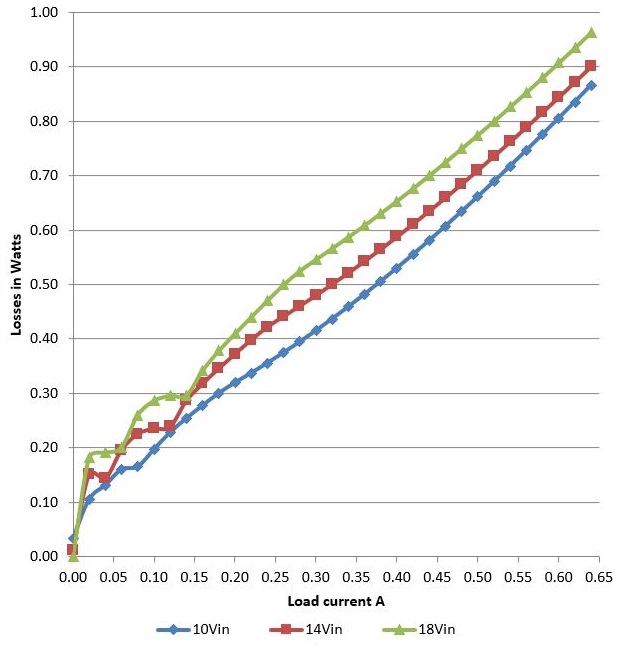 Figure 2-6 PMP23194 8-V DC/DC
Converter Losses
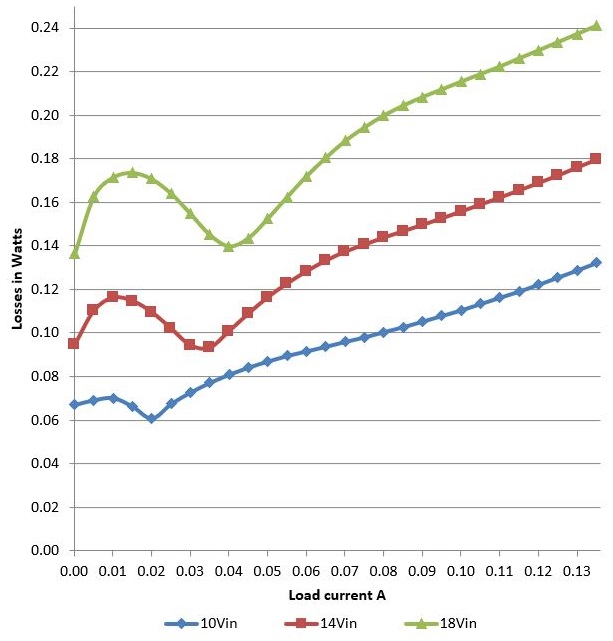 Figure 2-5 PMP23194 5-V DC/DC Converter Losses