TIDT279 October   2022


  1.   Description
  2.   Features
  3.   Applications
  4. 1Test Prerequisites
    1. 1.1 Power and Load Connections and Test Points
    2. 1.2 Voltage and Current Requirements
    3. 1.3 Required Equipment
    4. 1.4 Considerations
    5. 1.5 Board Dimensions
  5. 2Testing and Results
    1. 2.1 Efficiency and Loss Graphs
    2. 2.2 Thermal Images
    3. 2.3 Bode Plots
    4. 2.4 Conducted Emissions vs CISPR Class 5
  6. 3Waveforms
    1. 3.1 Output Voltage Ripple
    2. 3.2 Load Transients
    3. 3.3 Start-Up of Each Independently-Controlled Output

Output Voltage Ripple

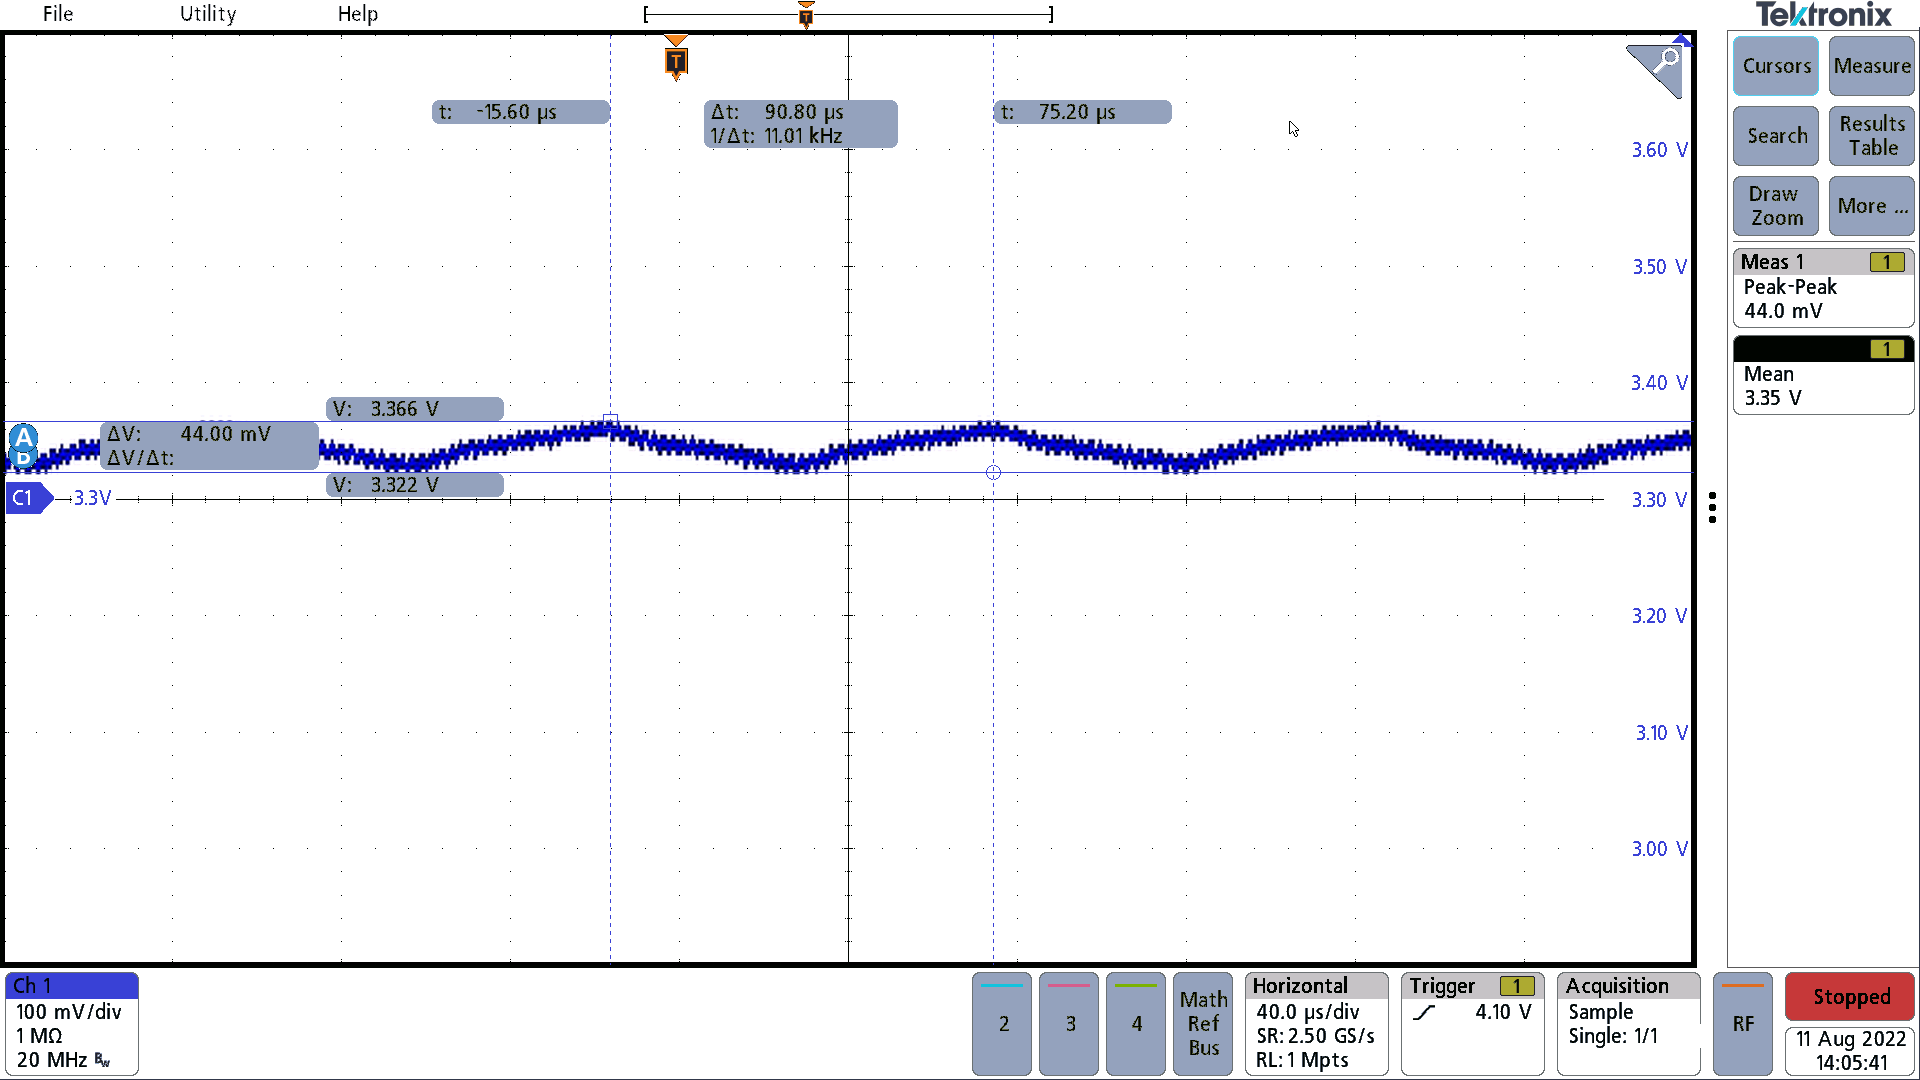
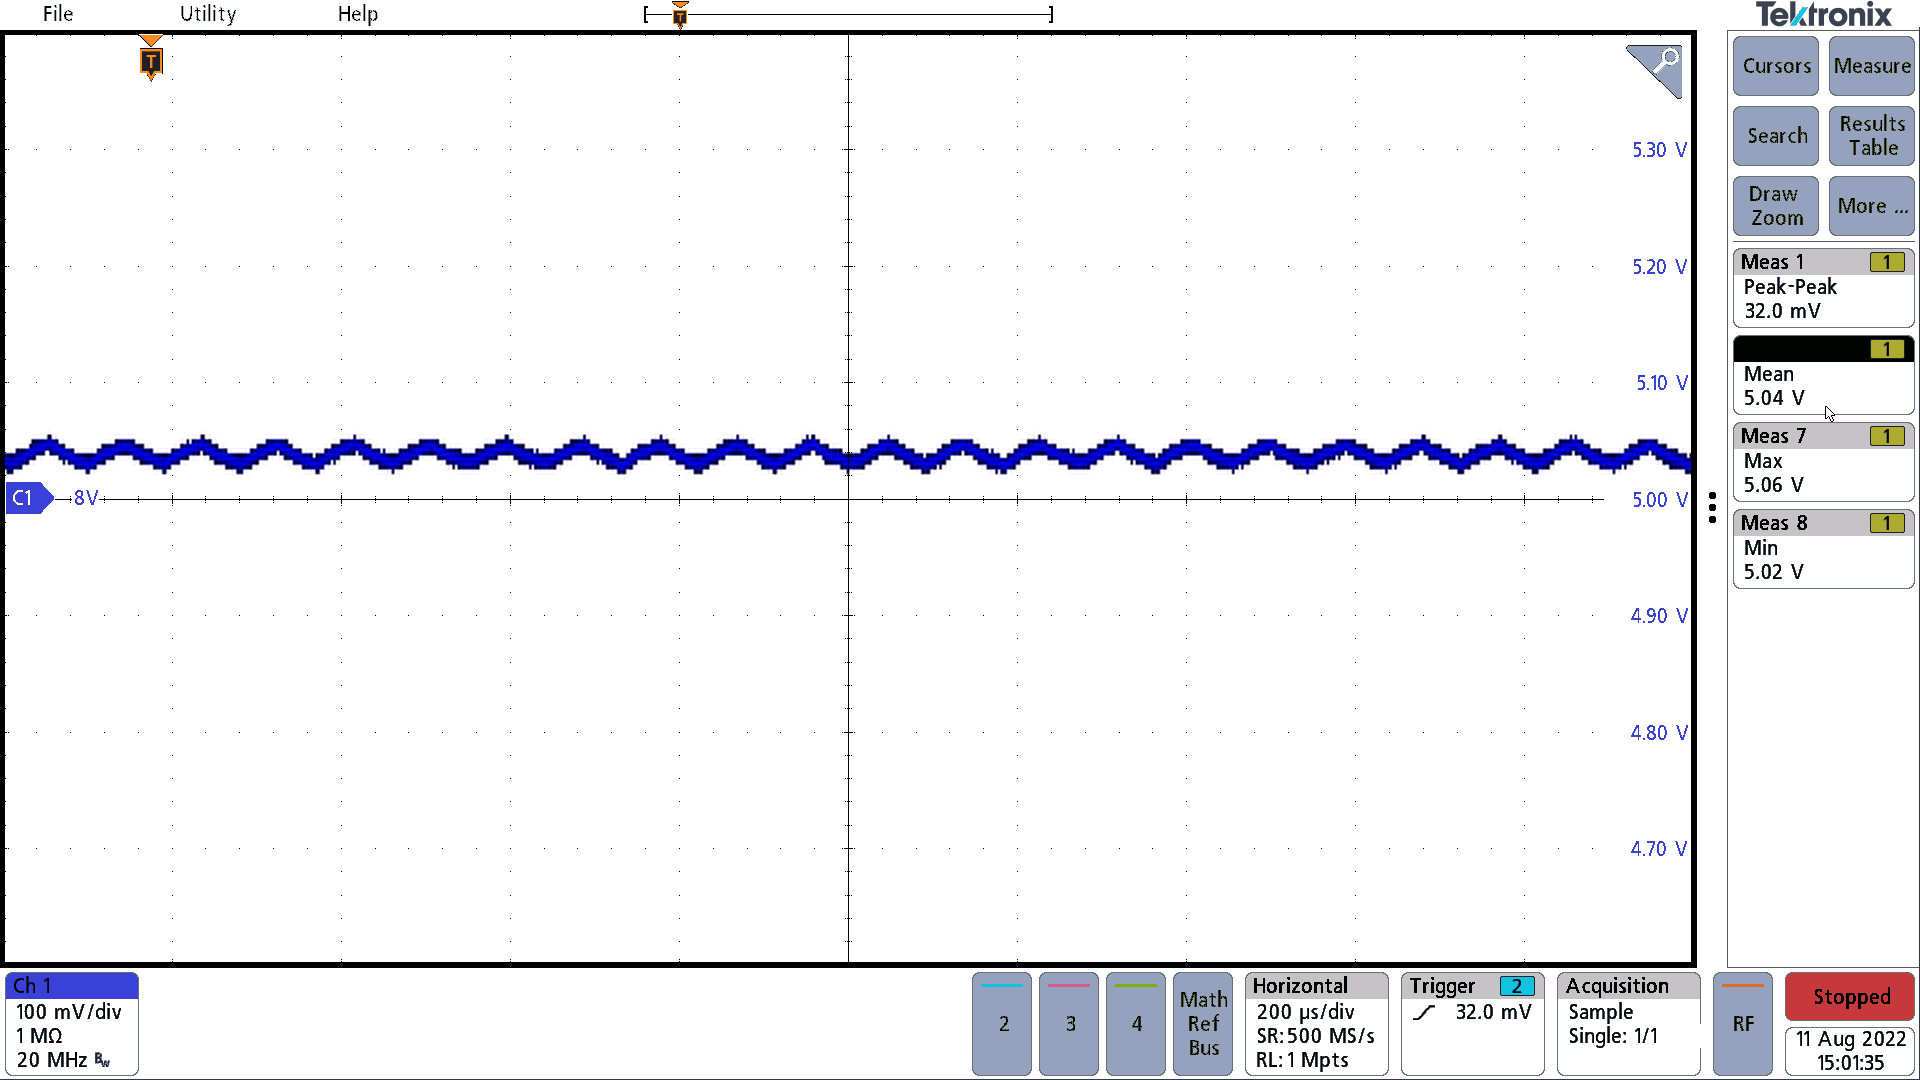
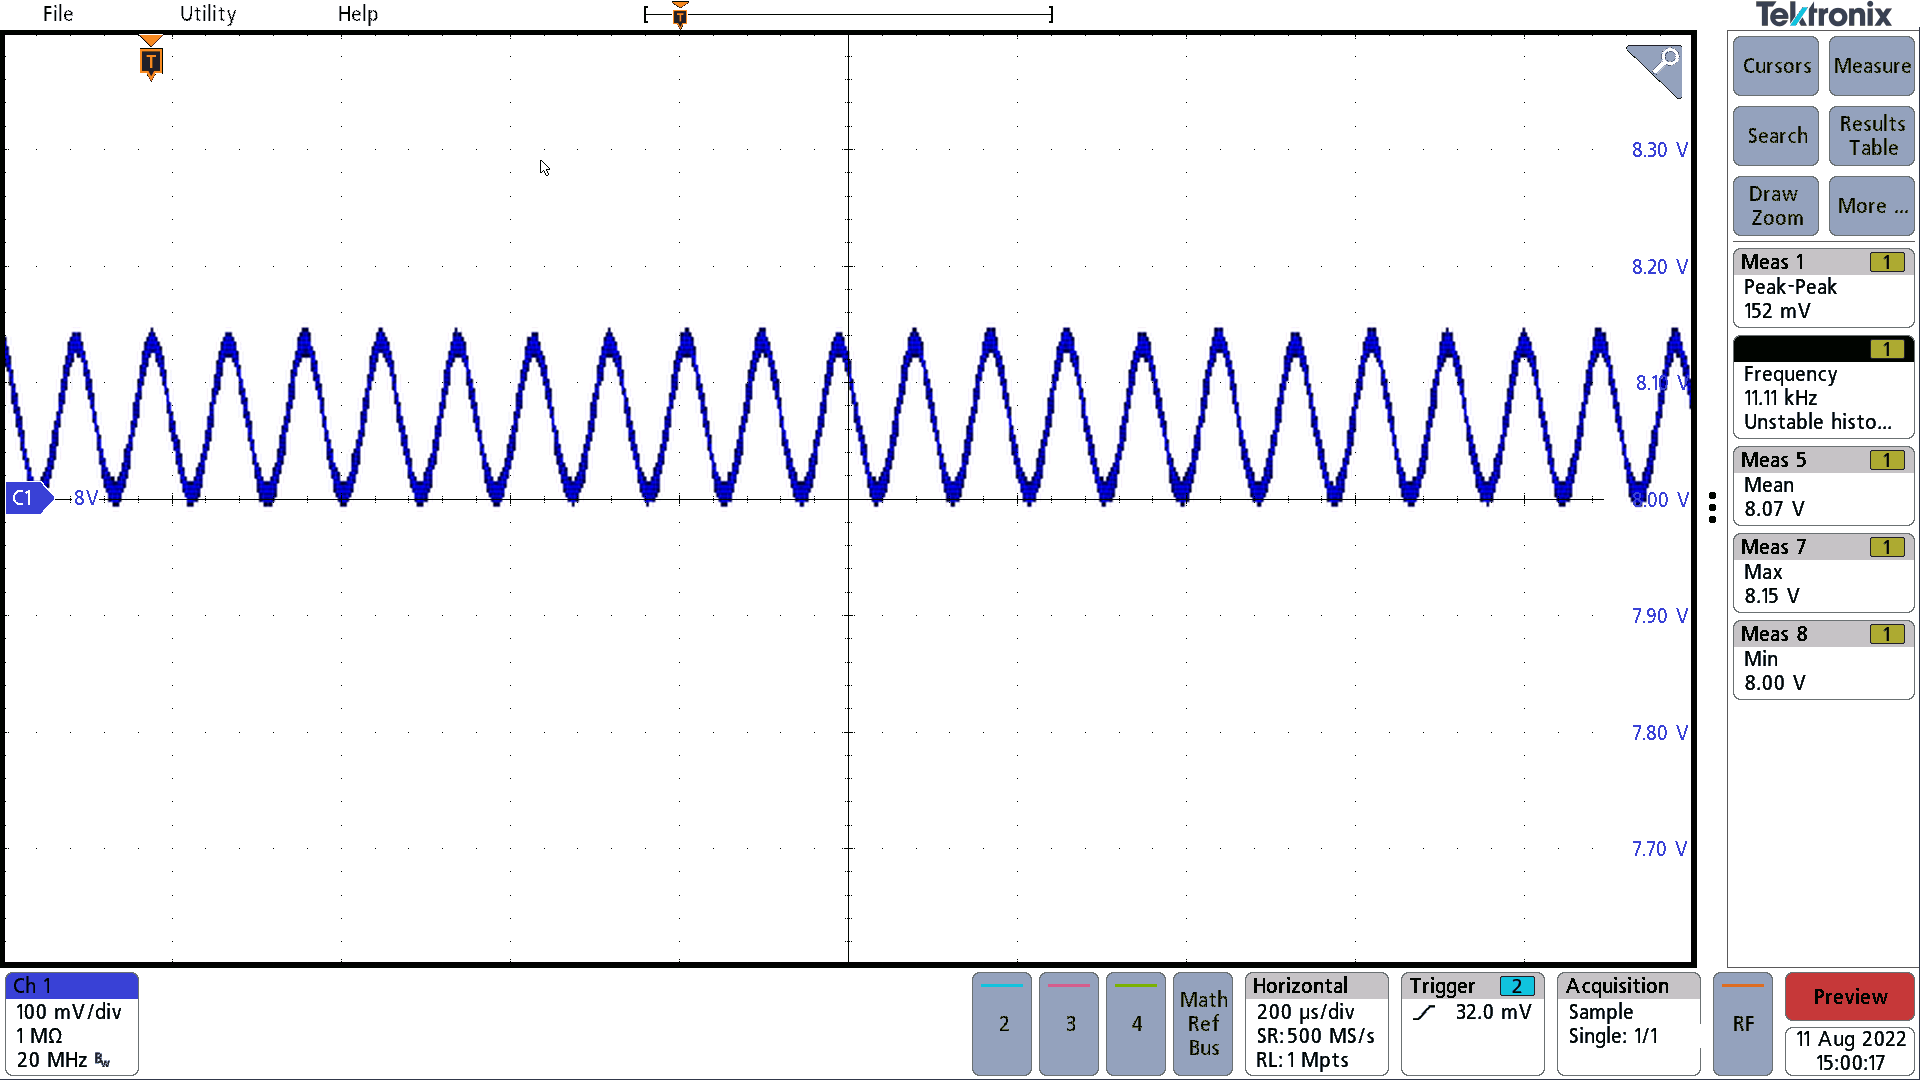
Figure 3-1 through Figure 3-3 show the output voltage ripple waveforms with switching frequency dithering turned on. Ripple is from the 11-kHz dithering of the main 440-kHz switching frequency dominated the overall output ripple for all three outputs.
GUID-20220913-SS0I-NH9G-NW4M-PKPDFVTHDDVX-low.png
40 mV peak to peak
Figure 3-1 Output Voltage Ripple 3.3 V, 6.7 A off 14 VIN
GUID-20220913-SS0I-MRM6-PH8N-VVFMT8BJN0BP-low.png
40 mV peak to peak
Figure 3-2 Output Voltage Ripple 5 V, 120 mA off 14 VIN
GUID-20220913-SS0I-NTCL-HKX1-7M3ZPHBWPDQC-low.png
150 mV peak to peak
Figure 3-3 Output Voltage Ripple 8 V, 600 mA off 14 VIN