TIDT279 October   2022


  1.   Description
  2.   Features
  3.   Applications
  4. 1Test Prerequisites
    1. 1.1 Power and Load Connections and Test Points
    2. 1.2 Voltage and Current Requirements
    3. 1.3 Required Equipment
    4. 1.4 Considerations
    5. 1.5 Board Dimensions
  5. 2Testing and Results
    1. 2.1 Efficiency and Loss Graphs
    2. 2.2 Thermal Images
    3. 2.3 Bode Plots
    4. 2.4 Conducted Emissions vs CISPR Class 5
  6. 3Waveforms
    1. 3.1 Output Voltage Ripple
    2. 3.2 Load Transients
    3. 3.3 Start-Up of Each Independently-Controlled Output

Bode Plots

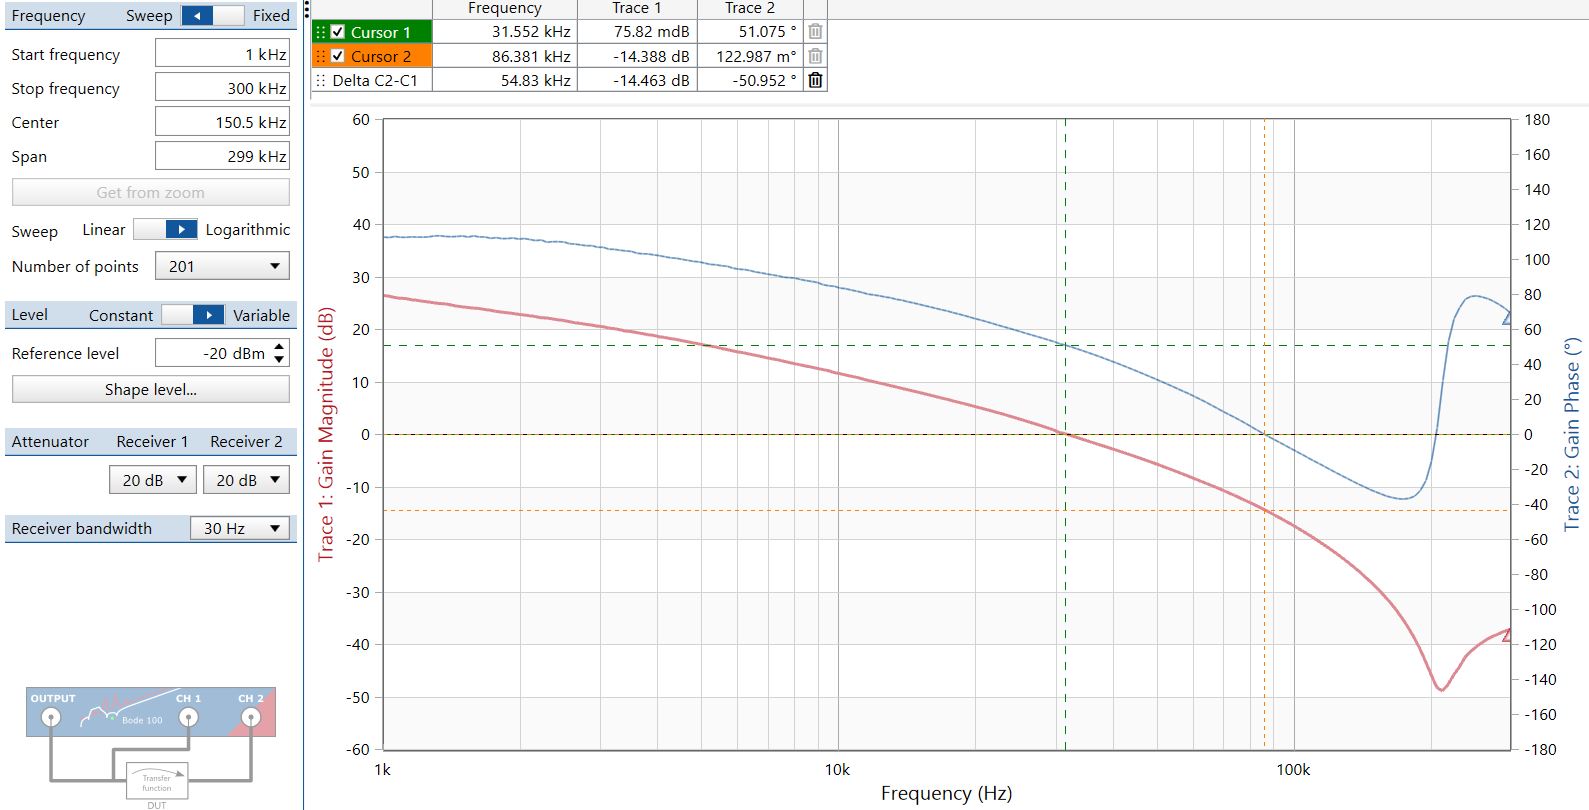
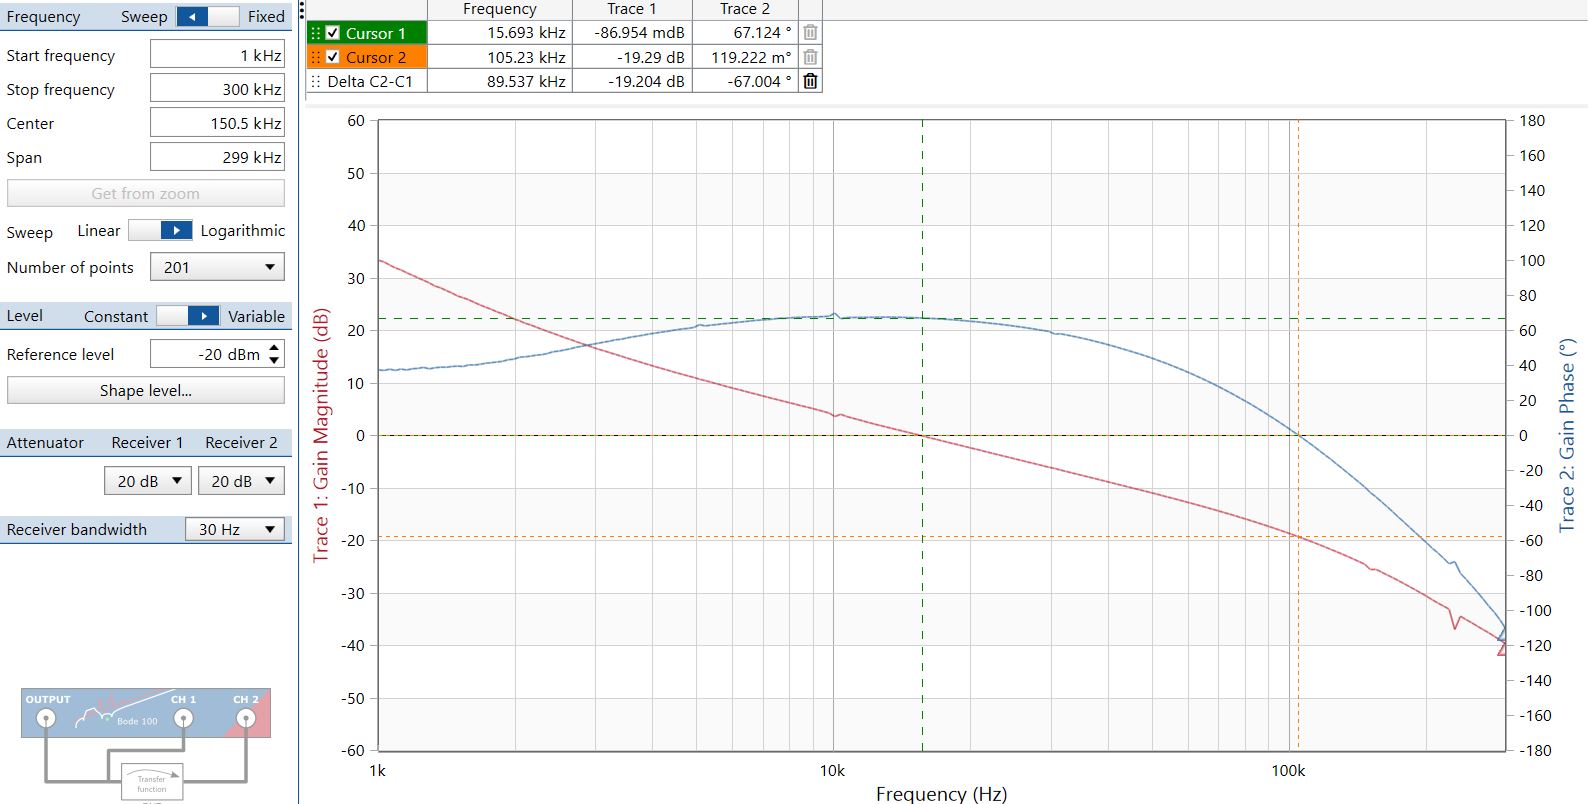
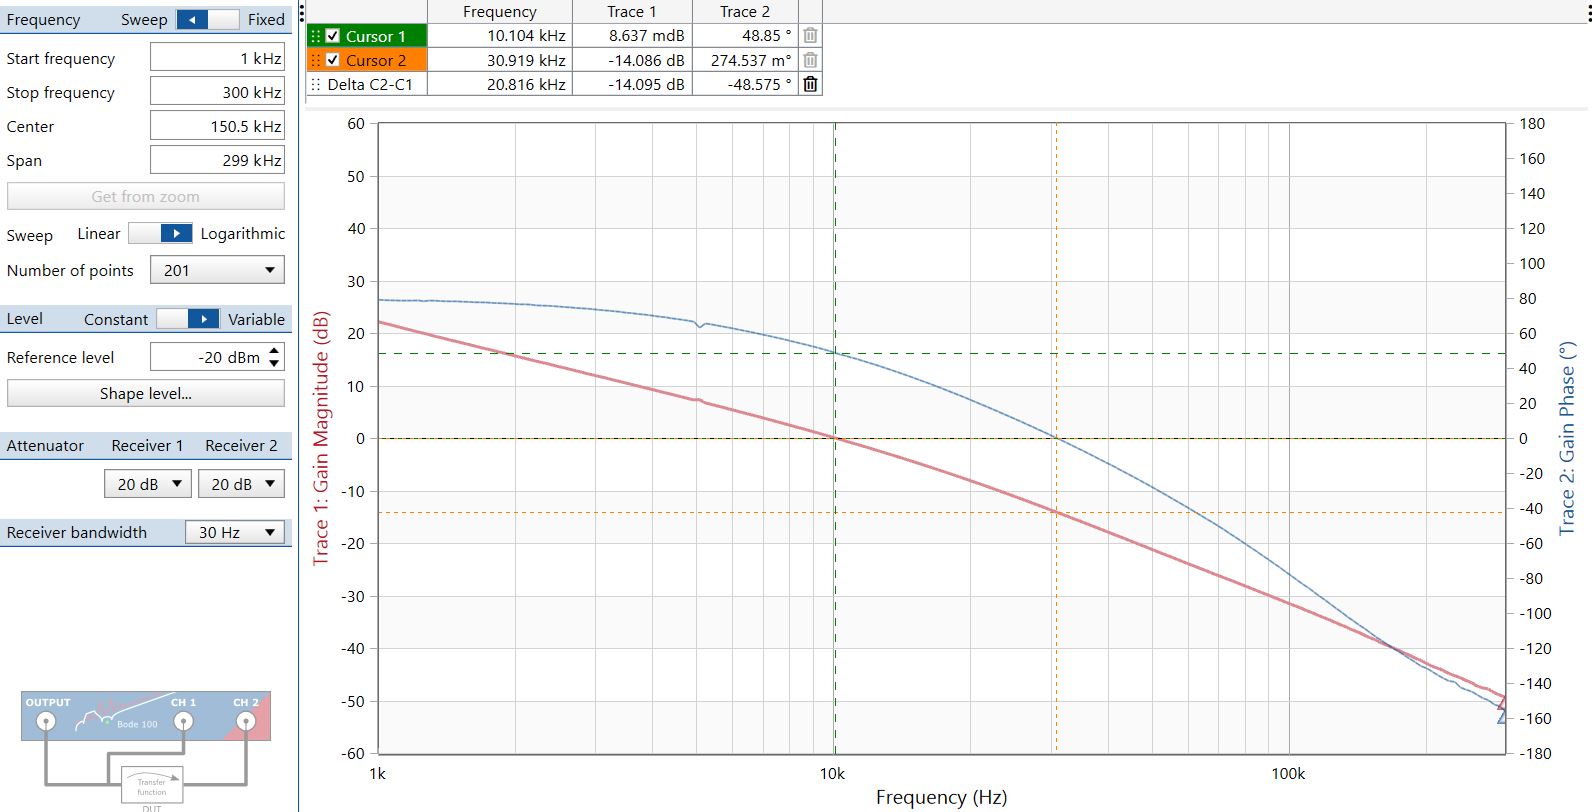
Figure 2-11 through Figure 2-13 show the bode plots with 14 VIN for 3.3-V, 5-V, and 8-V outputs respectively.
GUID-20220913-SS0I-HFCX-LKTN-X2TCGG1HKHTS-low.jpg
Crossover at 32 kHz with 51 degrees of phase margin, –180 degrees shift at 86 kHz with 14-dB gain margin
Figure 2-11 3.3-V, 3-A Bode Plot off 14 VIN
GUID-20220913-SS0I-RBZD-GJWQ-B0T5HXVXBHW0-low.jpg
Crossover at 16 kHz with 67 degrees of phase margin, –180 degrees shift at 105 kHz with 19-dB gain margin
Figure 2-12 5-V, 120-mA Bode Plot off 14 VIN
GUID-20220913-SS0I-JFXS-LCBF-BPFXSX9WDNQ4-low.jpg
Crossover at 10 kHz with 49 degrees of phase margin, –180 degrees shift at 31 kHz with 14-dB gain margin
Figure 2-13 8-V, 600-mA Bode Plot off 14 VIN