TIDT282 May   2022


  1.   Description
  2.   Features
  3.   Applications
  4. 1Test Prerequisites
    1. 1.1 Voltage and Current Requirements
    2. 1.2 Required Equipment
    3. 1.3 Considerations
    4. 1.4 Dimensions
  5. 2Testing and Results
    1. 2.1 Efficiency Graphs
    2. 2.2 Efficiency Data
    3. 2.3 Output Voltage Regulation
    4. 2.4 Thermal
  6. 3Waveforms
    1. 3.1 Switching
    2. 3.2 Output Voltage Ripple
    3. 3.3 Start-Up Sequence
    4. 3.4 Shutdown Sequence

Efficiency Graphs

Figure 2-1 shows the efficiency graph versus output current. The load current shown increases from zero to 750 mA. The voltage of the power source was set to 4.5 V and 6 V.
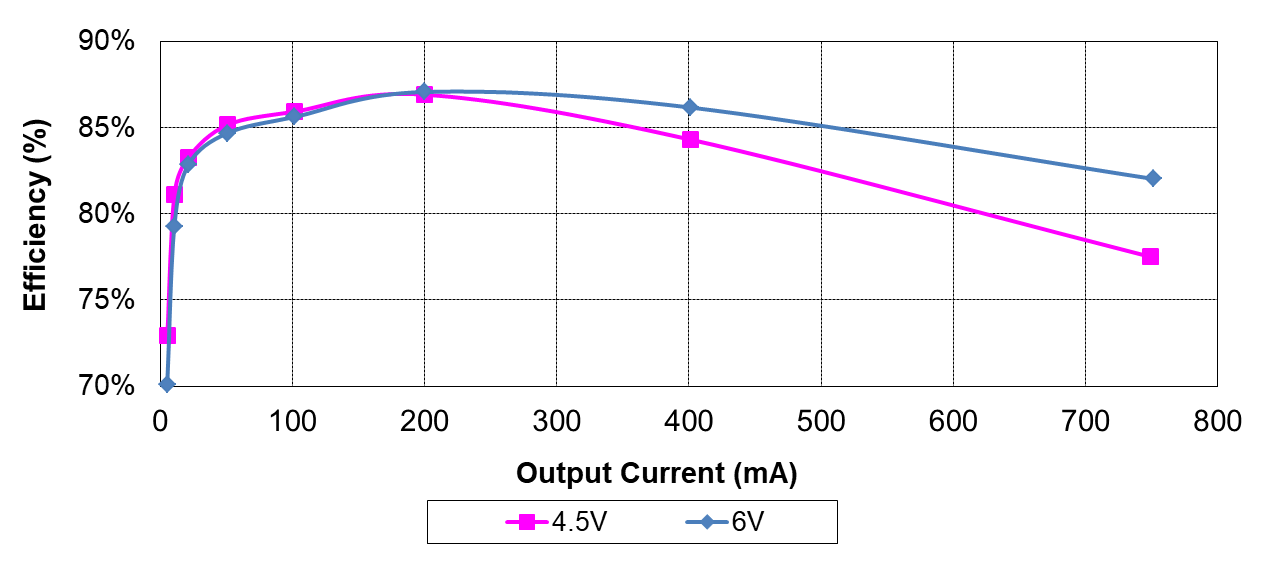
GUID-20220427-SS0I-XBPC-SGFF-MSWH0WXXKPXK-low.png Figure 2-1 Efficiency Graph