TIDT282 May 2022
2.4 Thermal
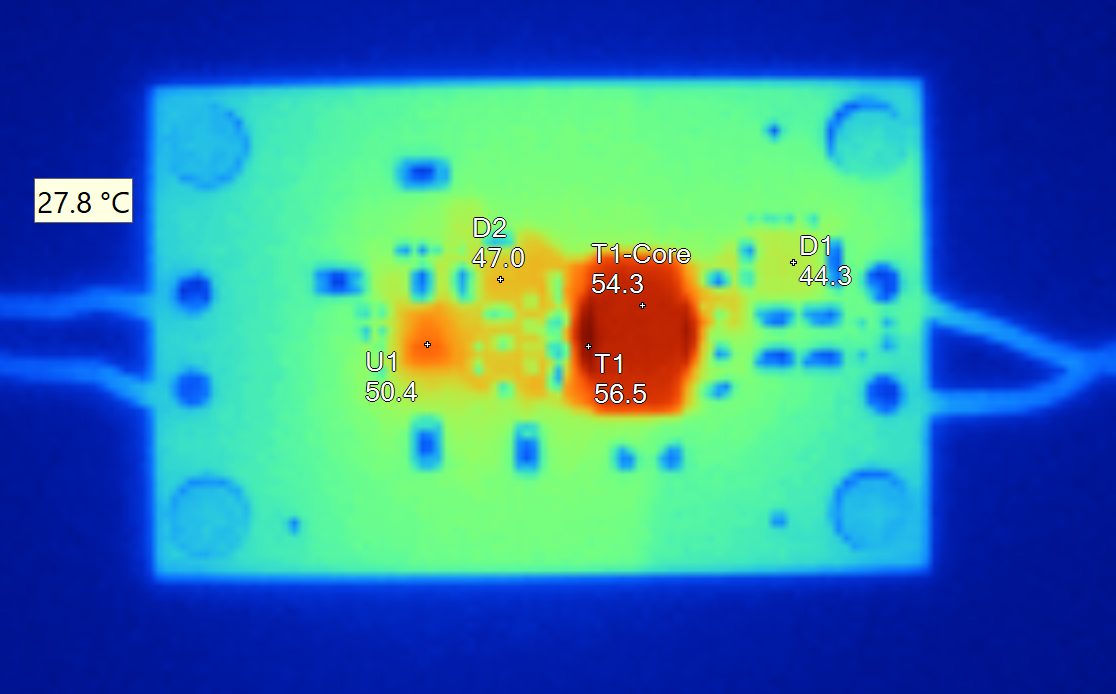
The following graph and table describe the thermal behavior of the converter placed horizontally on the bench, at full load, with ambient temperature of 25.5°C and in a still air condition.

Conditions: VIN = 5
VDC, fully loaded; image taken after 60 minutes
Figure 2-3 Thermal ImageTable 2-1 Main Image Markers
| Name | Temperature | Emissivity | Background |
|---|---|---|---|
|
T1 |
56.5°C |
0.96 |
25.5°C |
|
T1-Core |
54.3°C |
0.96 |
25.5°C |
|
U1 |
50.4°C |
0.96 |
25.5°C |
|
D1 |
44.3°C |
0.96 |
25.5°C |
|
D2 |
47.0°C |
0.96 |
25.5°C |