TIDT306 October   2022


  1.   Description
  2.   Features
  3.   Applications
  4. 1Test Prerequisites
    1. 1.1 Voltage and Current Requirements
    2. 1.2 Required Equipment
    3. 1.3 Test Setup
  5. 2Testing and Results
    1. 2.1 Efficiency Graphs of PFC Stage
    2. 2.2 Efficiency Data of PFC Stage
    3. 2.3 Efficiency Graphs of LLC Stage
    4. 2.4 Efficiency Data of LLC Stage
    5. 2.5 Thermal Images
  6. 3Waveforms
    1. 3.1 Steady State
    2. 3.2 Switching
    3. 3.3 Load Transients

Load Transients

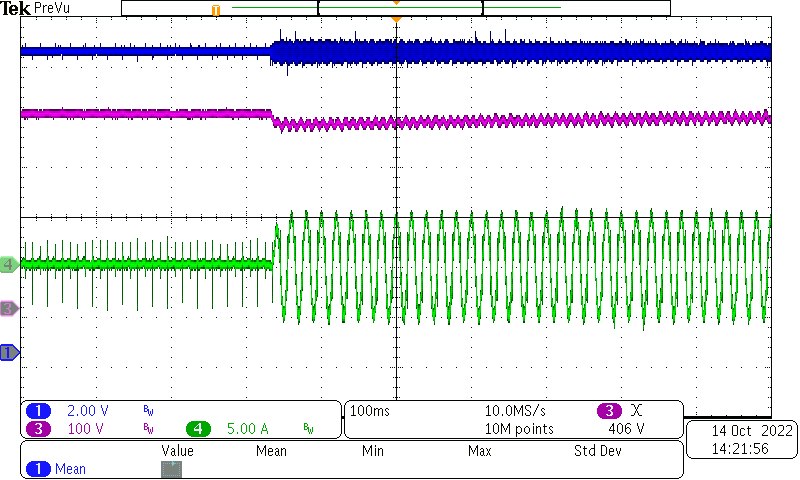
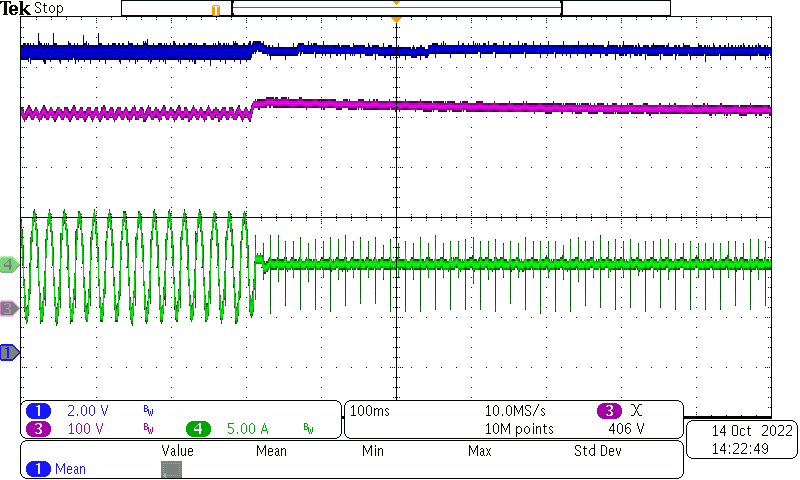
The load transient waveforms were captured at 230 VAC.
GUID-20221014-SS0I-PXGF-RXMT-CQD3KQDZBQVG-low.png
CH1: Output Voltage, CH3: VBUS, CH4: Input Current
Figure 3-8 0% Load to 50% Load
GUID-20221014-SS0I-GJGL-KH3Q-ZG6RFKCJ4DWN-low.png
CH1: Output Voltage, CH3: VBUS, CH4: Input Current
Figure 3-9 50% Load to 0% Load