TIDT318 January 2023
2.1 Efficiency Graphs
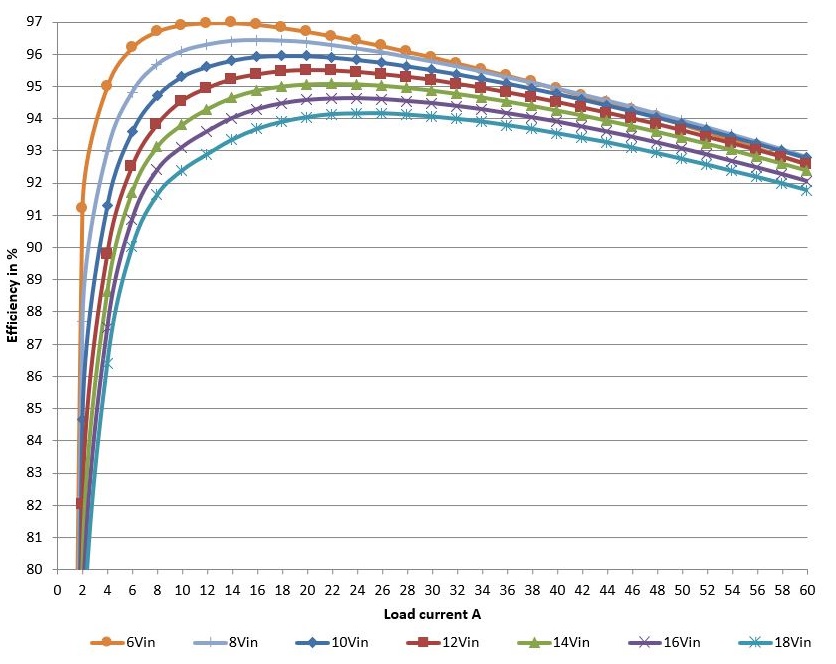
Efficiency is shown over the input voltage range of 6 V to 18 V.
Figure 2-1 illustrates that at full 60-A load, efficiency is in the 92% to 93% range. At 30 A, loading efficiency is in the 94% to 96 % range.
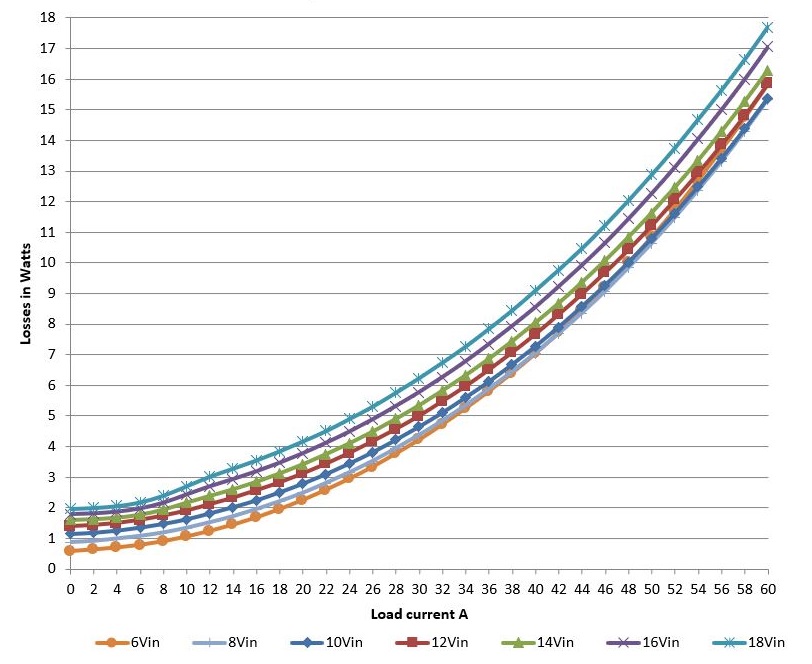
The efficiency graph is followed by the conversion loss vs load current graph (Figure 2-2) over the same 6-V to 18-V input range. No load loss varies from under 1 W at 6-V and 8-V input to just under 2 W at 18-V input. The full load loss range is 15.3 W at 8-V input to 17.7 W at 18-V input.
 Figure 2-1 3.3-V, 2-Phase Conversion Efficiency
 Figure 2-2 3.3-V, 2-Phase Conversion Losses