TIDT323 june 2023
- 1
- Description
- Features
- Applications
- 1System Specification
-
2Results
- 2.1 Efficiency Graph, Voltage Mode
- 2.2 Efficiency Data, Voltage Mode
- 2.3 Efficiency Graph, Current Mode
- 2.4 Efficiency Data, Current Mode
- 2.5 Load Regulation, Voltage Mode
- 2.6 Load Regulation, Current Mode
- 2.7 Line Regulation, Voltage Mode
- 2.8 Line Regulation, Current Mode
- 2.9 Thermal Images, Voltage Mode
- 2.10 Thermal Image, Current Mode
-
3Waveforms
- 3.1 Prebias Start-Up, Voltage Mode
- 3.2 Prebias Start-up, Current Mode
- 3.3 Output Voltage Ripple, Voltage Mode
- 3.4 Output Voltage Ripple, Current Mode
- 3.5 Load Transient, Voltage Mode
- 3.6 Load Transient, Current Mode
- 3.7 Line Transient, Voltage Mode
- 3.8 Line Transient, Current Mode
- 3.9 Phase Current Balancing, Voltage Mode
- 3.10 Phase Current Balancing, Current Mode
- 3.11 Loop Response, Voltage Mode
- 3.12 Loop Response, Current Mode
3.12 Loop Response, Current Mode
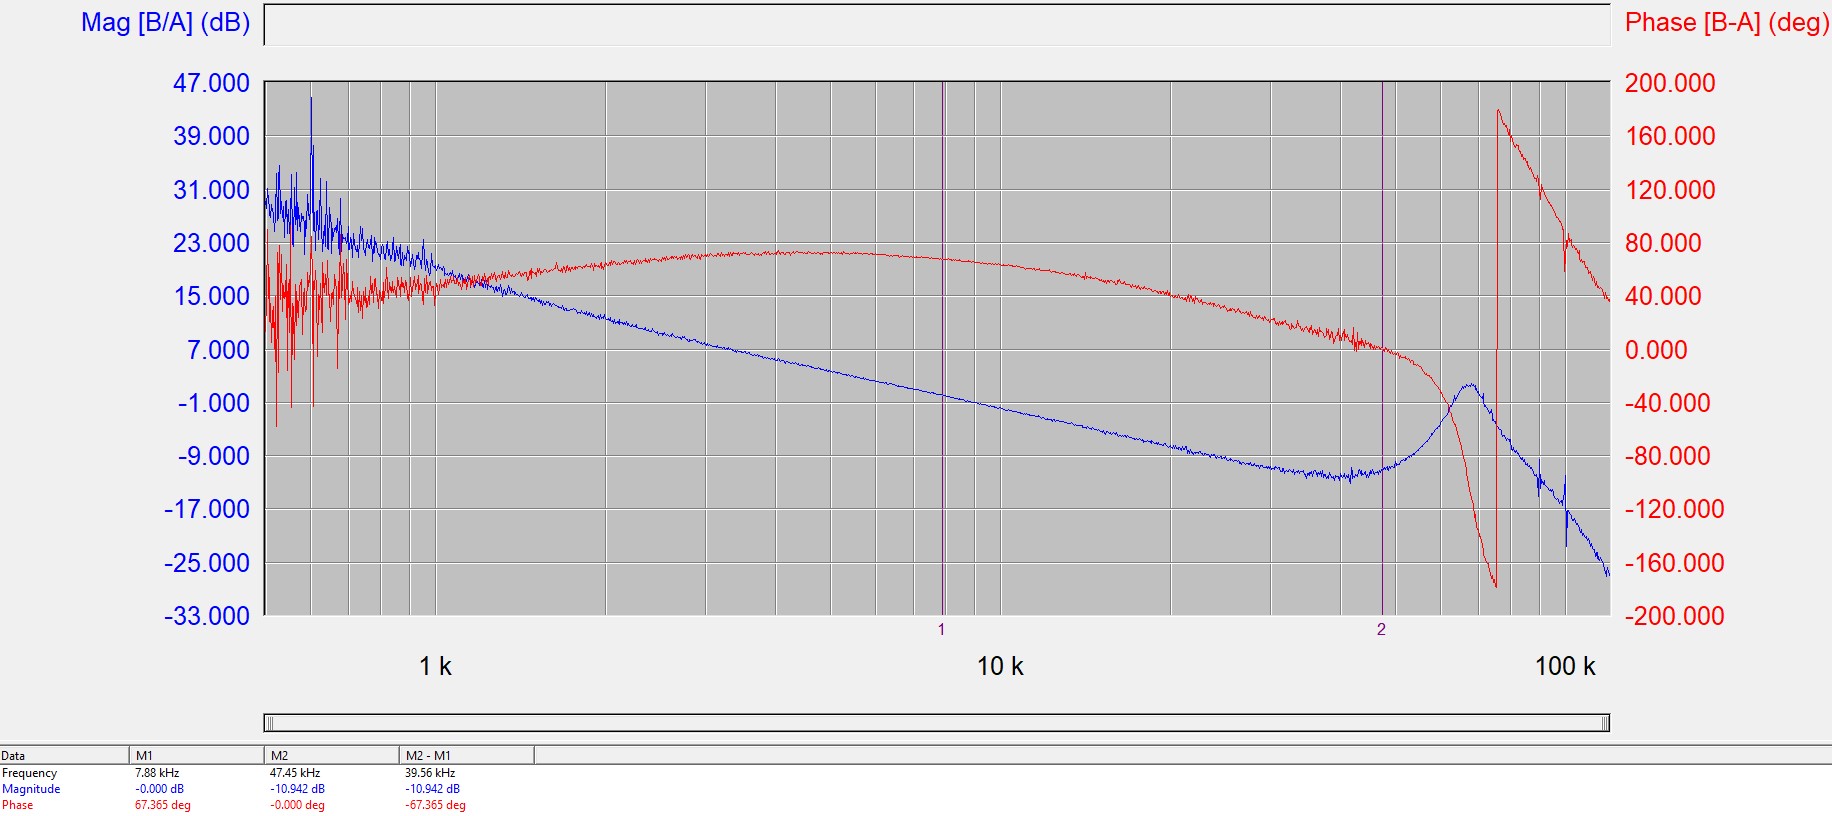
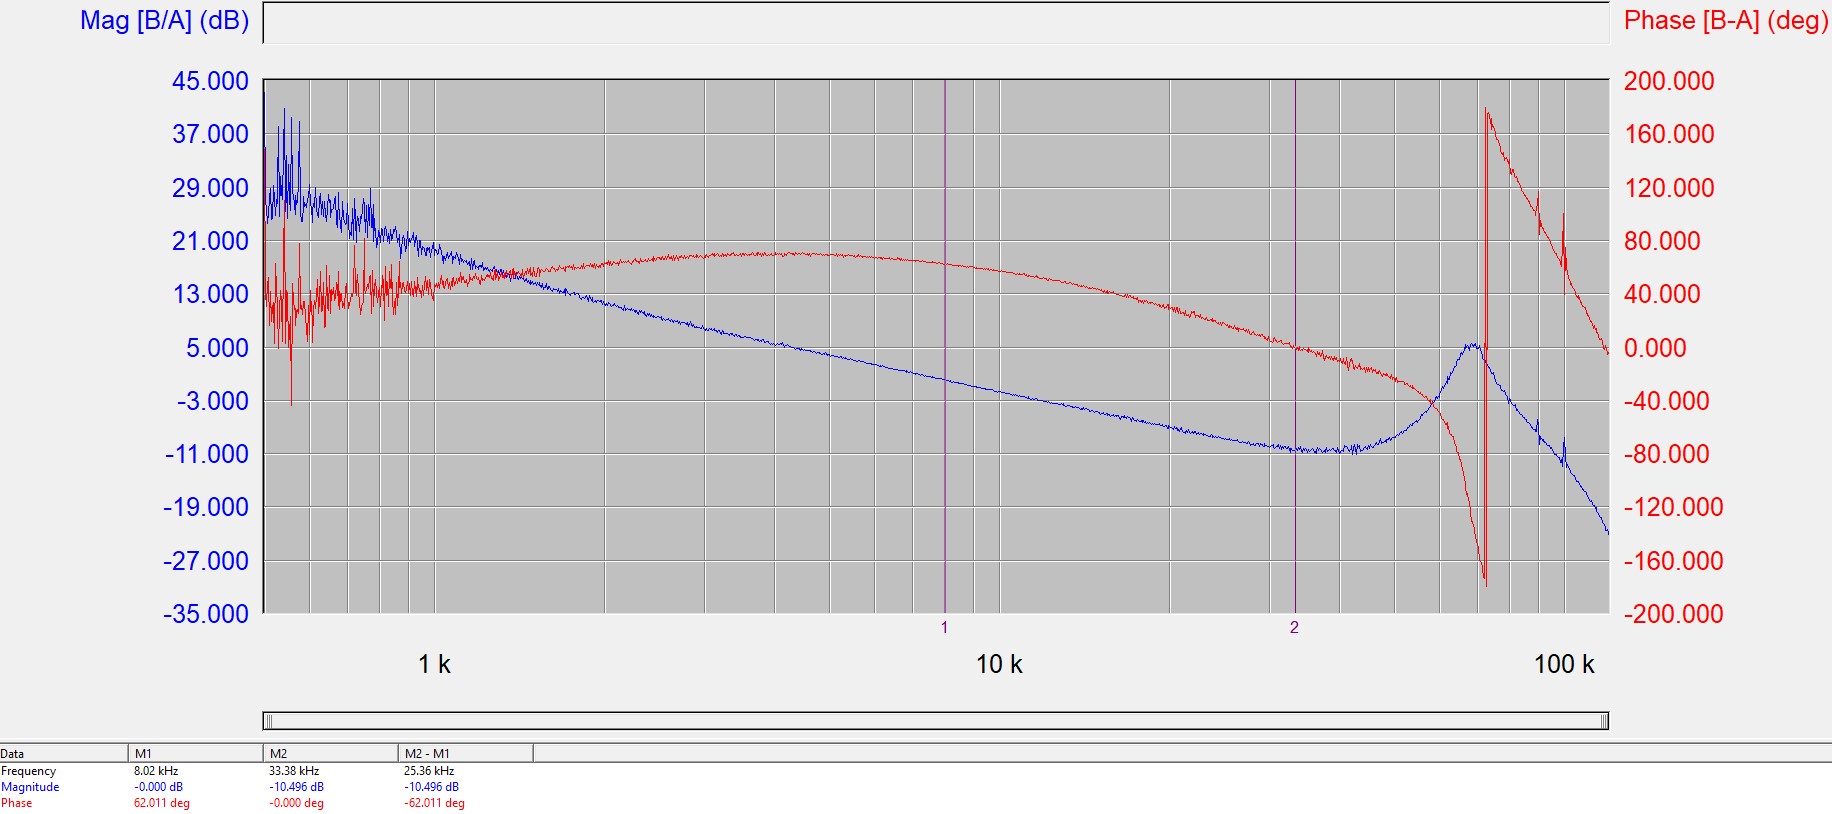
The waveforms of bode plot at half load and full load are shown in the following pictures.
 Figure 3-39 VOUT = 48 V, VIN = 48 V,
IOUT = 7 A
 Figure 3-40 VOUT = 52 V, IOUT = 4.5
A, Voltage Variation: 7 mV