TIDT331 august 2023
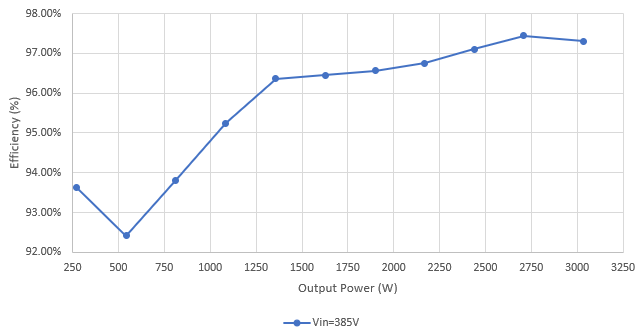
2.1 Efficiency Graph
The parameters of Figure 3-3 are taken under the following conditions:
- Switching frequency: 140 kHz
- Primary side GaN turn-on slew rate: 20 V/ns
- Output voltage: 54 V
- Dead-time range: 640 ns to 80 ns, auto-adjusted in code based on operating point
- Auxiliary bias not included
- Output current shunt resistors and ORing FETs are shorted
- Input voltage, input current, and output voltage are measured using Fluke 83-V digital multimeters
- Output current measured using a 1.997713-mΩ calibrated shunt resistor + Agilent 34401A 6-digit digital multimeter
- PFB0412EN-E fan used to provide forced air across PSFB power stage
 Figure 2-1 Efficiency Graph