TIDT331 august 2023
3.3 Steady-State Waveforms
The following waveforms illustrate the steady-state waveforms of the PSFB converter with constant-current loads from 10 A to 56 A.
C1 = Secondary Winding Voltage, C2 = Leg1 Low-Side PWM, C4 = Transformer Primary Current
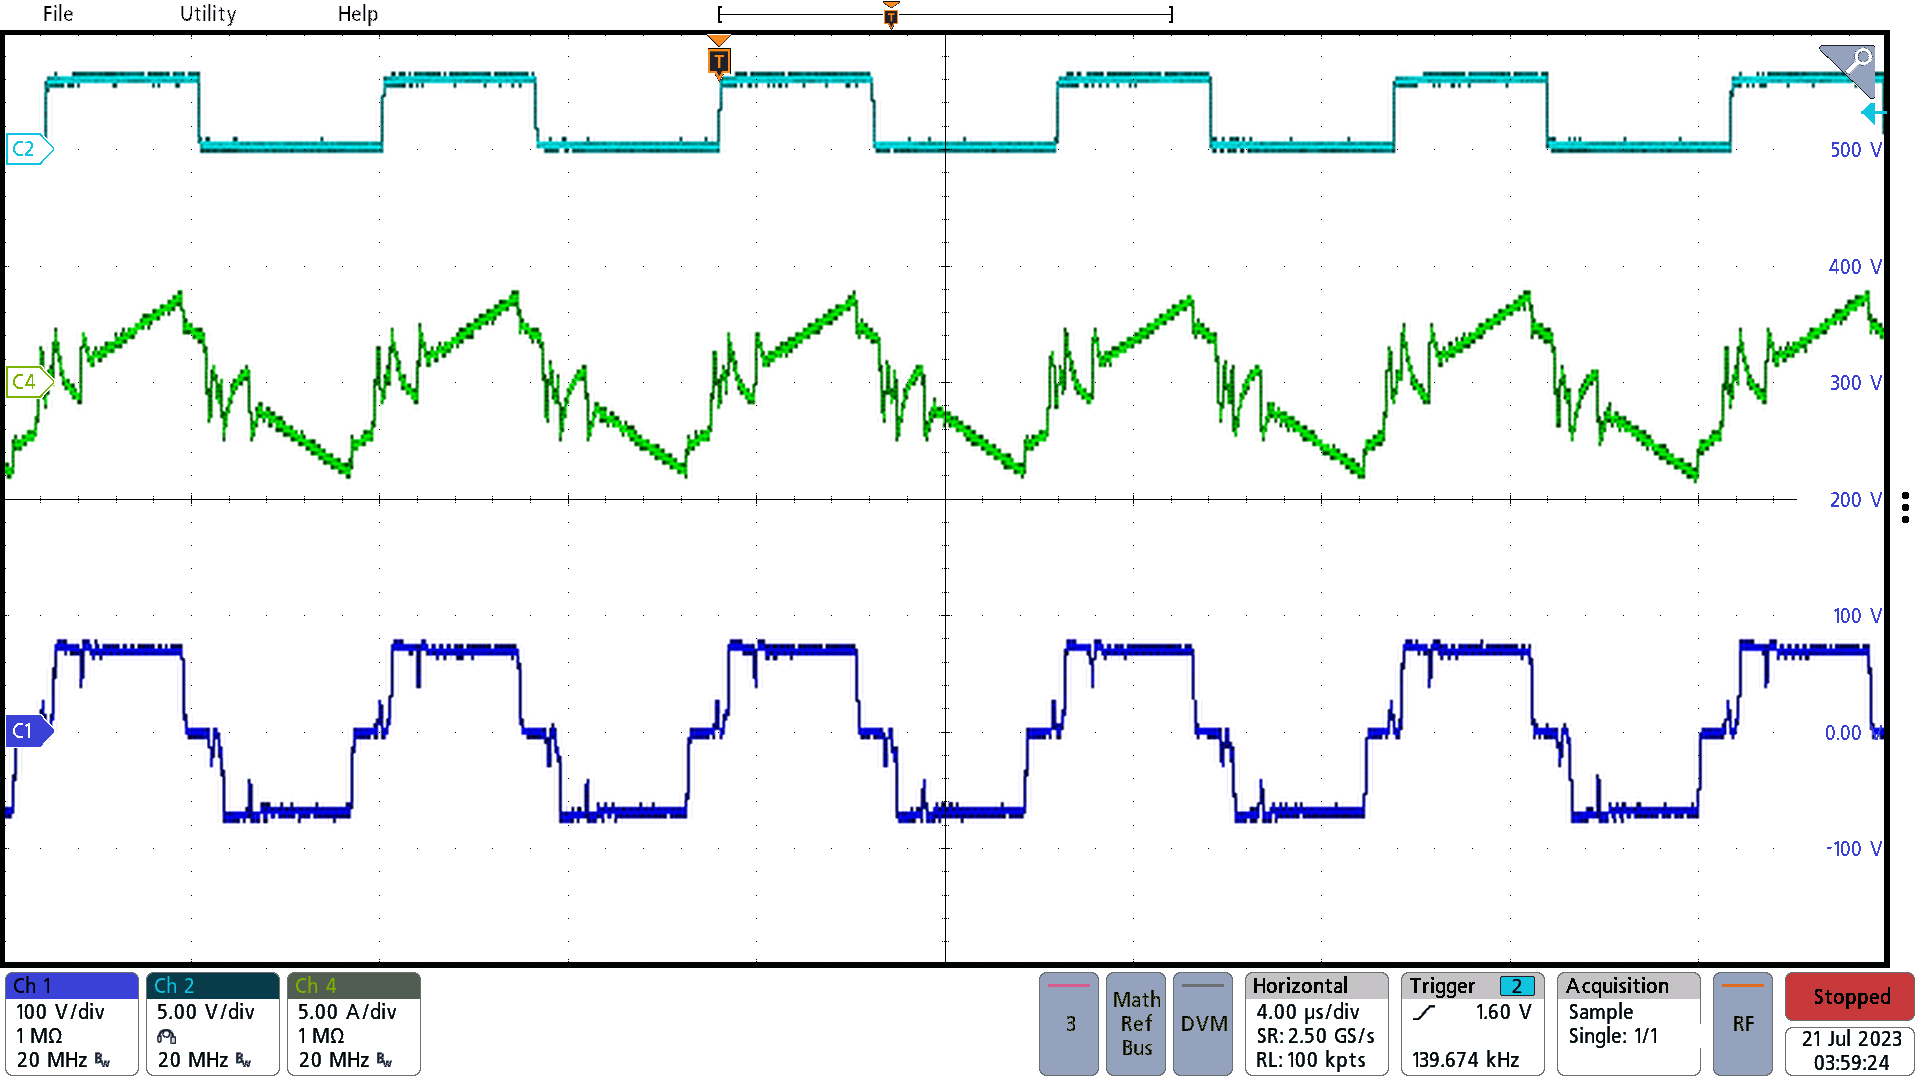 Figure 3-4 10-A Load
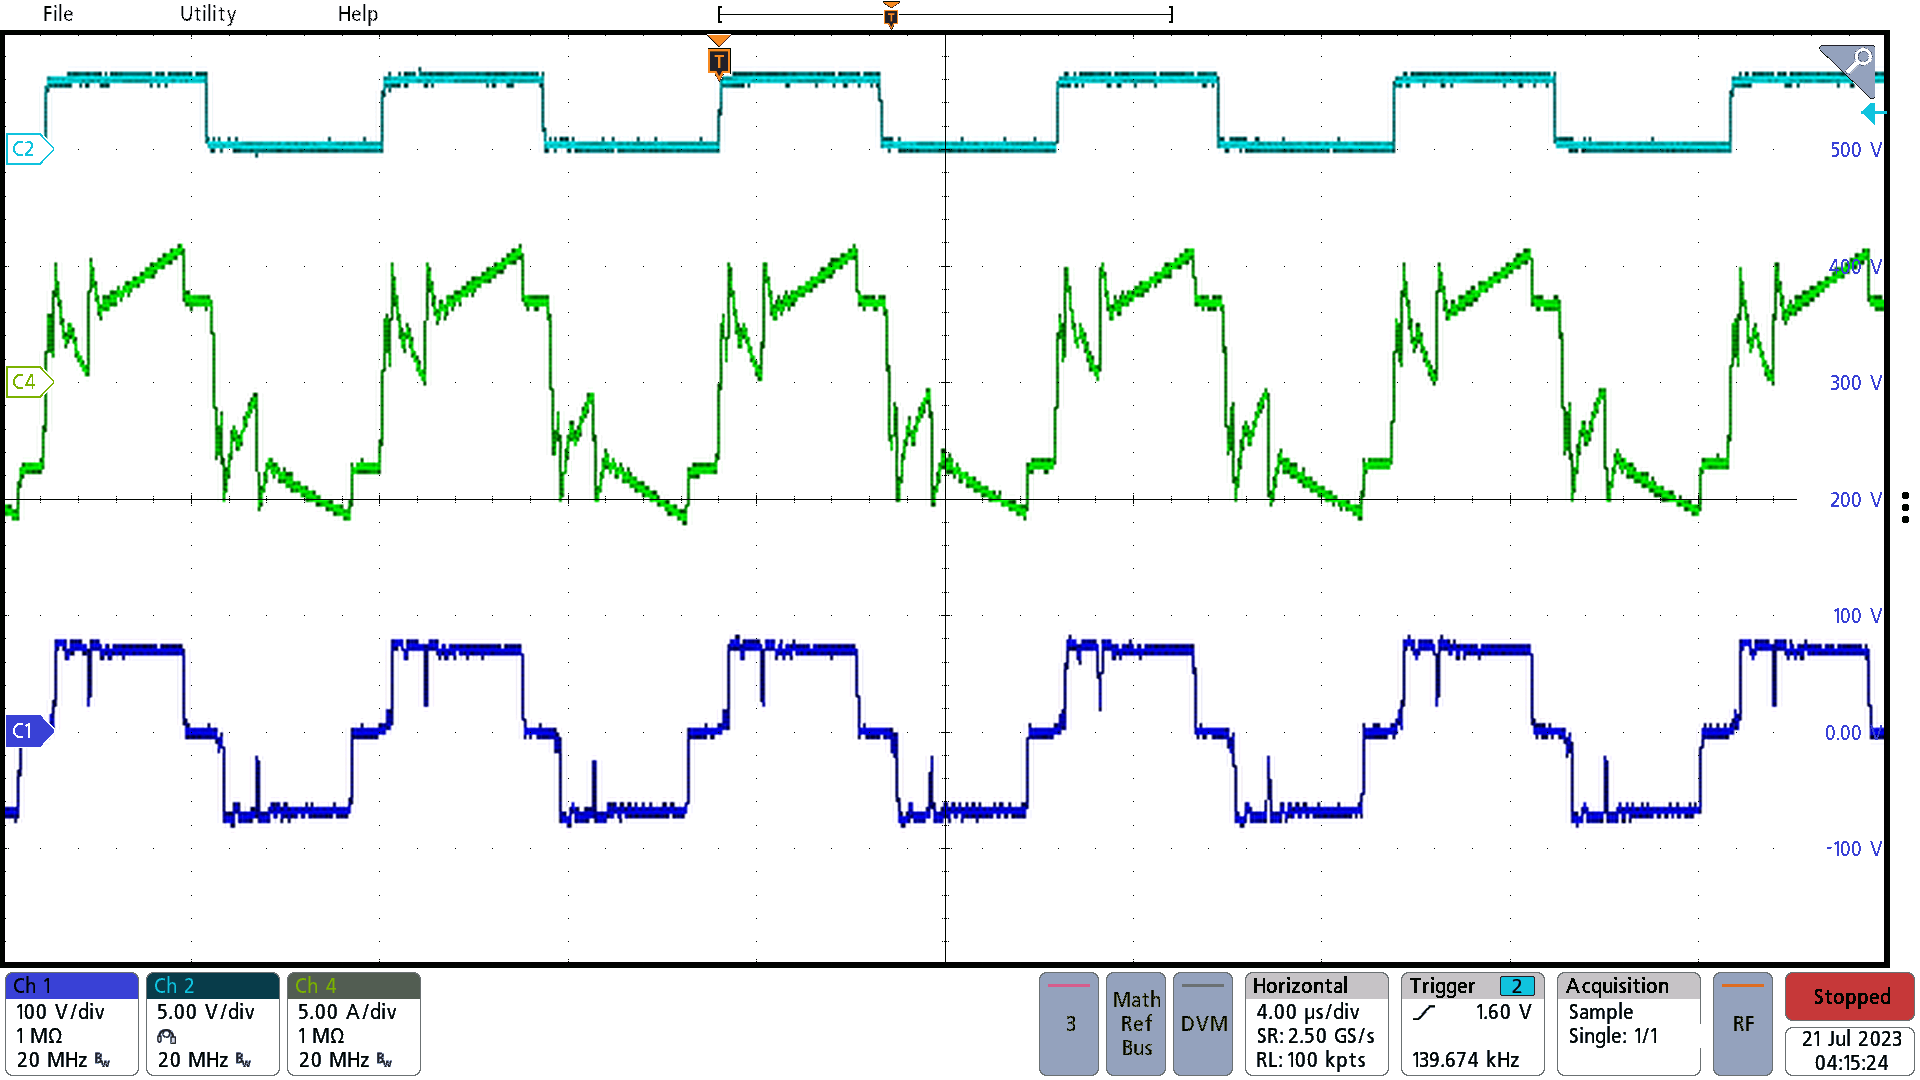 Figure 3-5 20-A Load
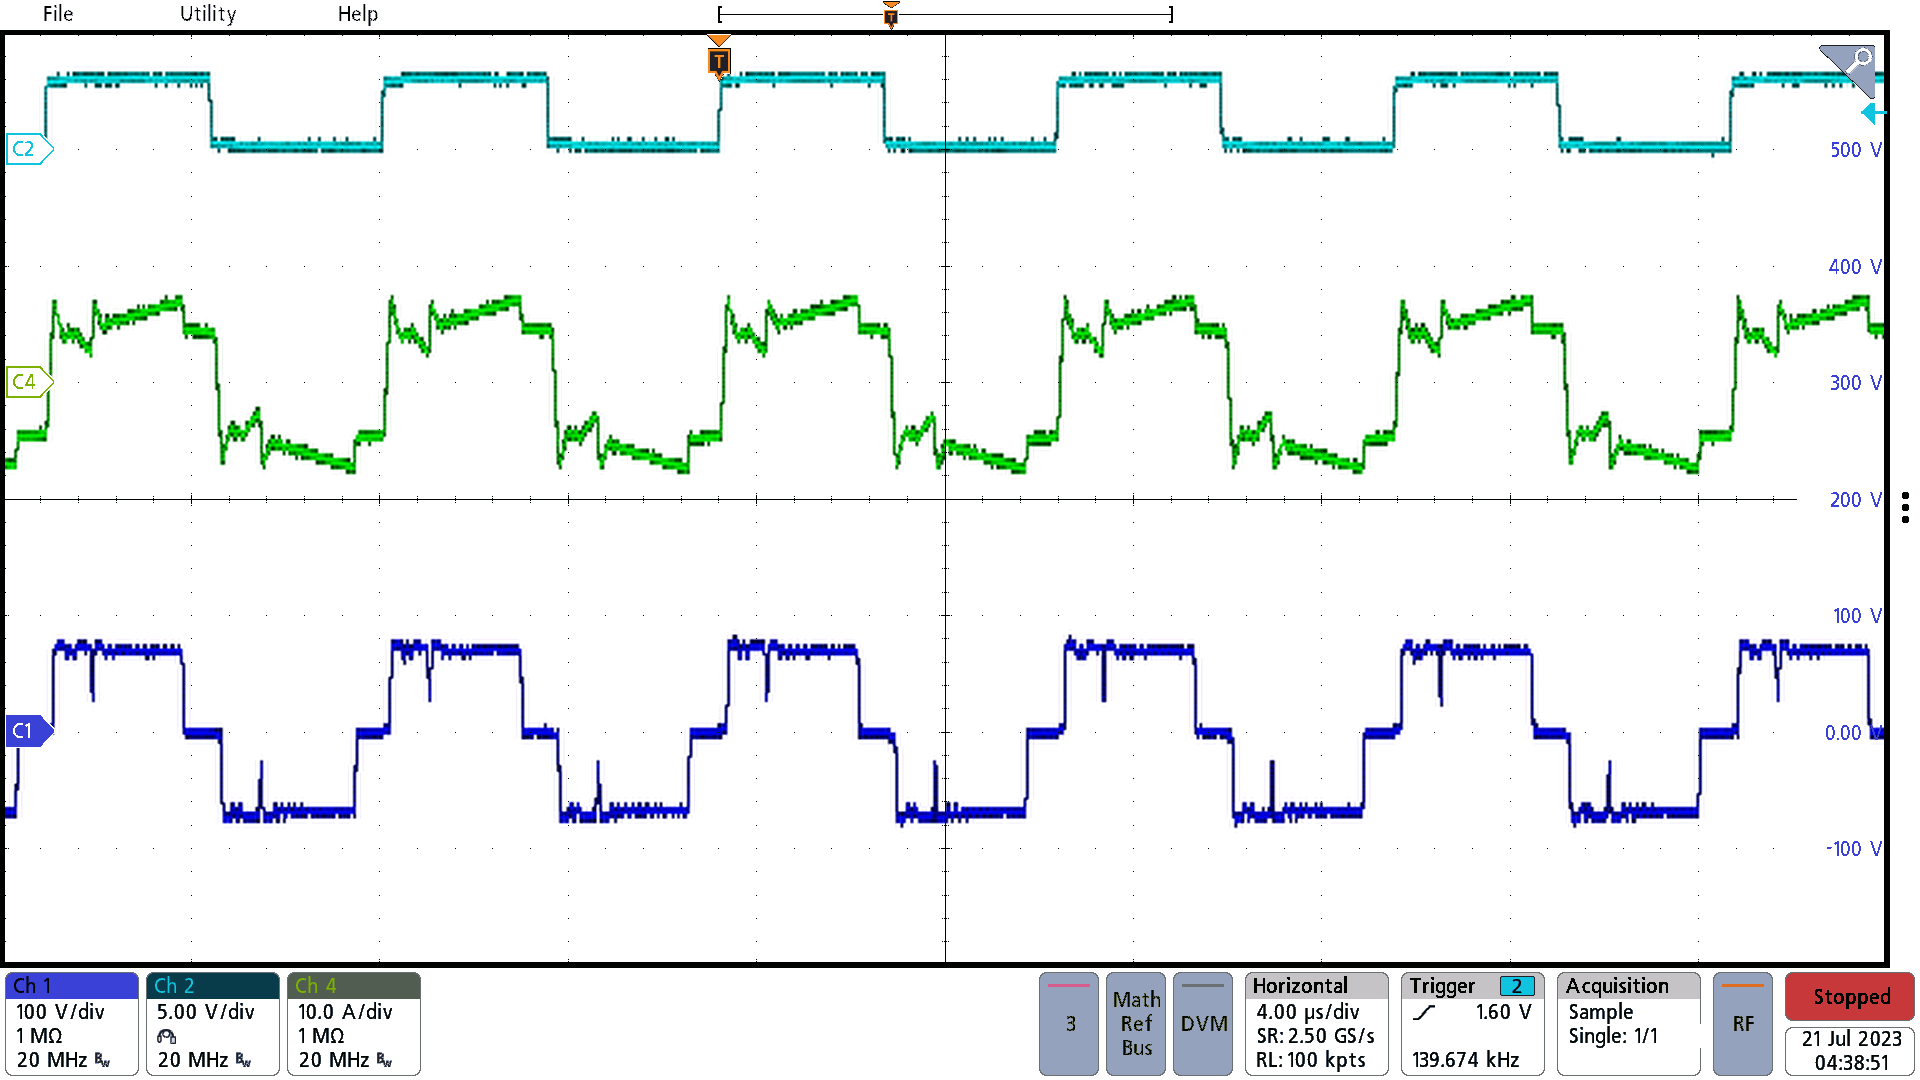 Figure 3-6 30-A Load
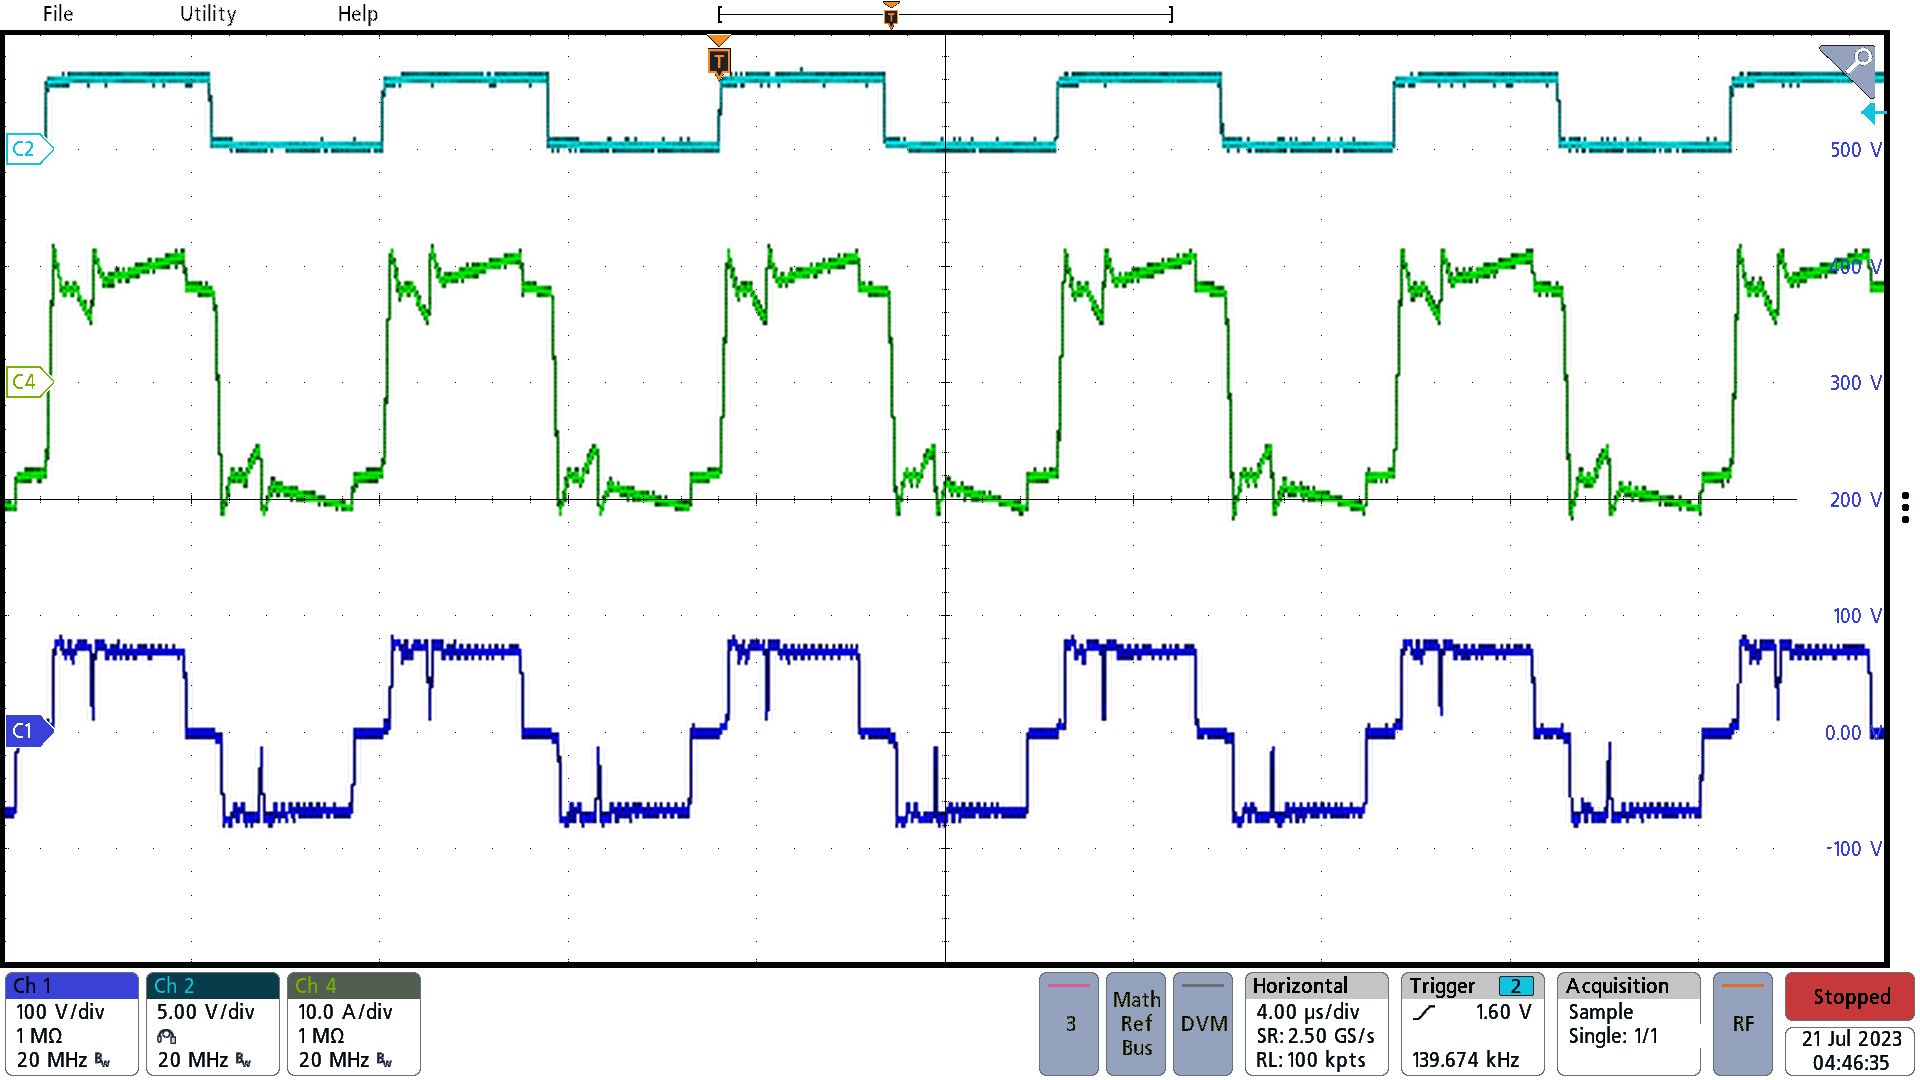 Figure 3-8 50-A Load
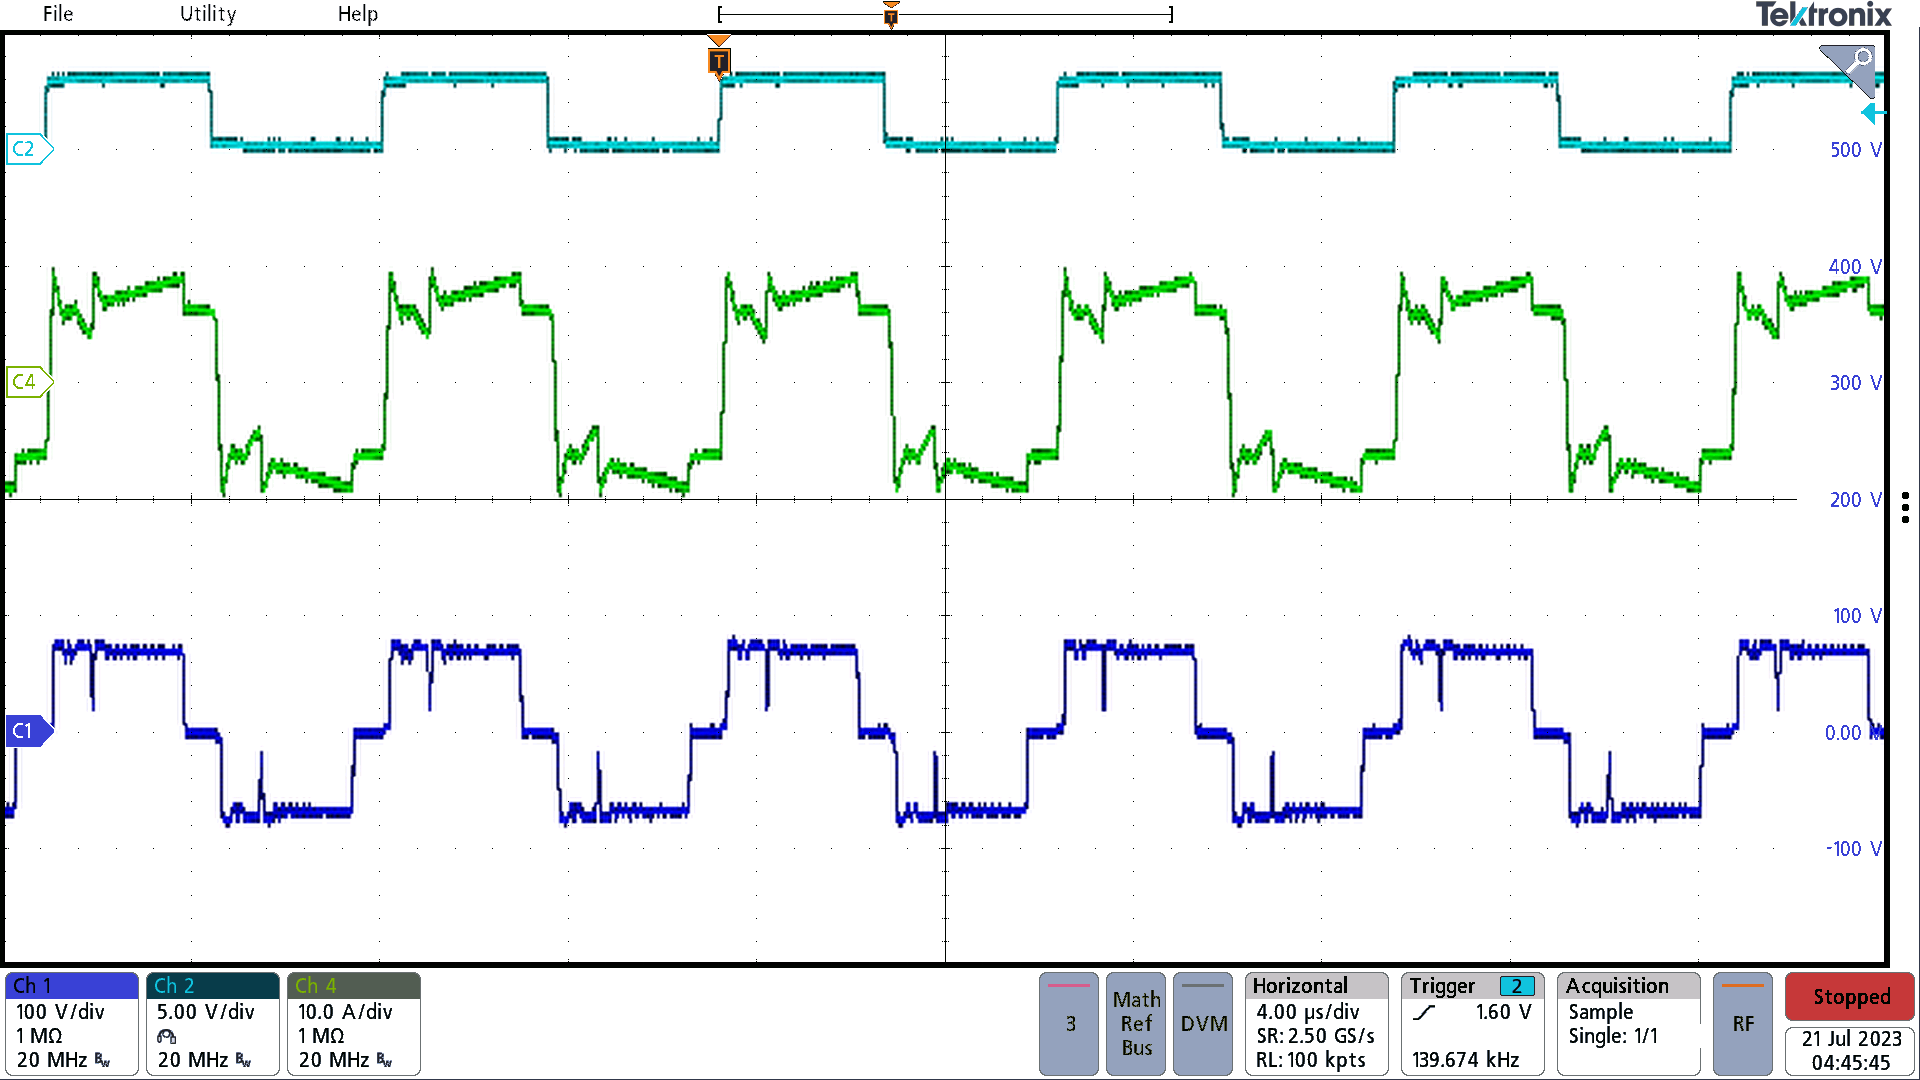 Figure 3-7 40-A Load
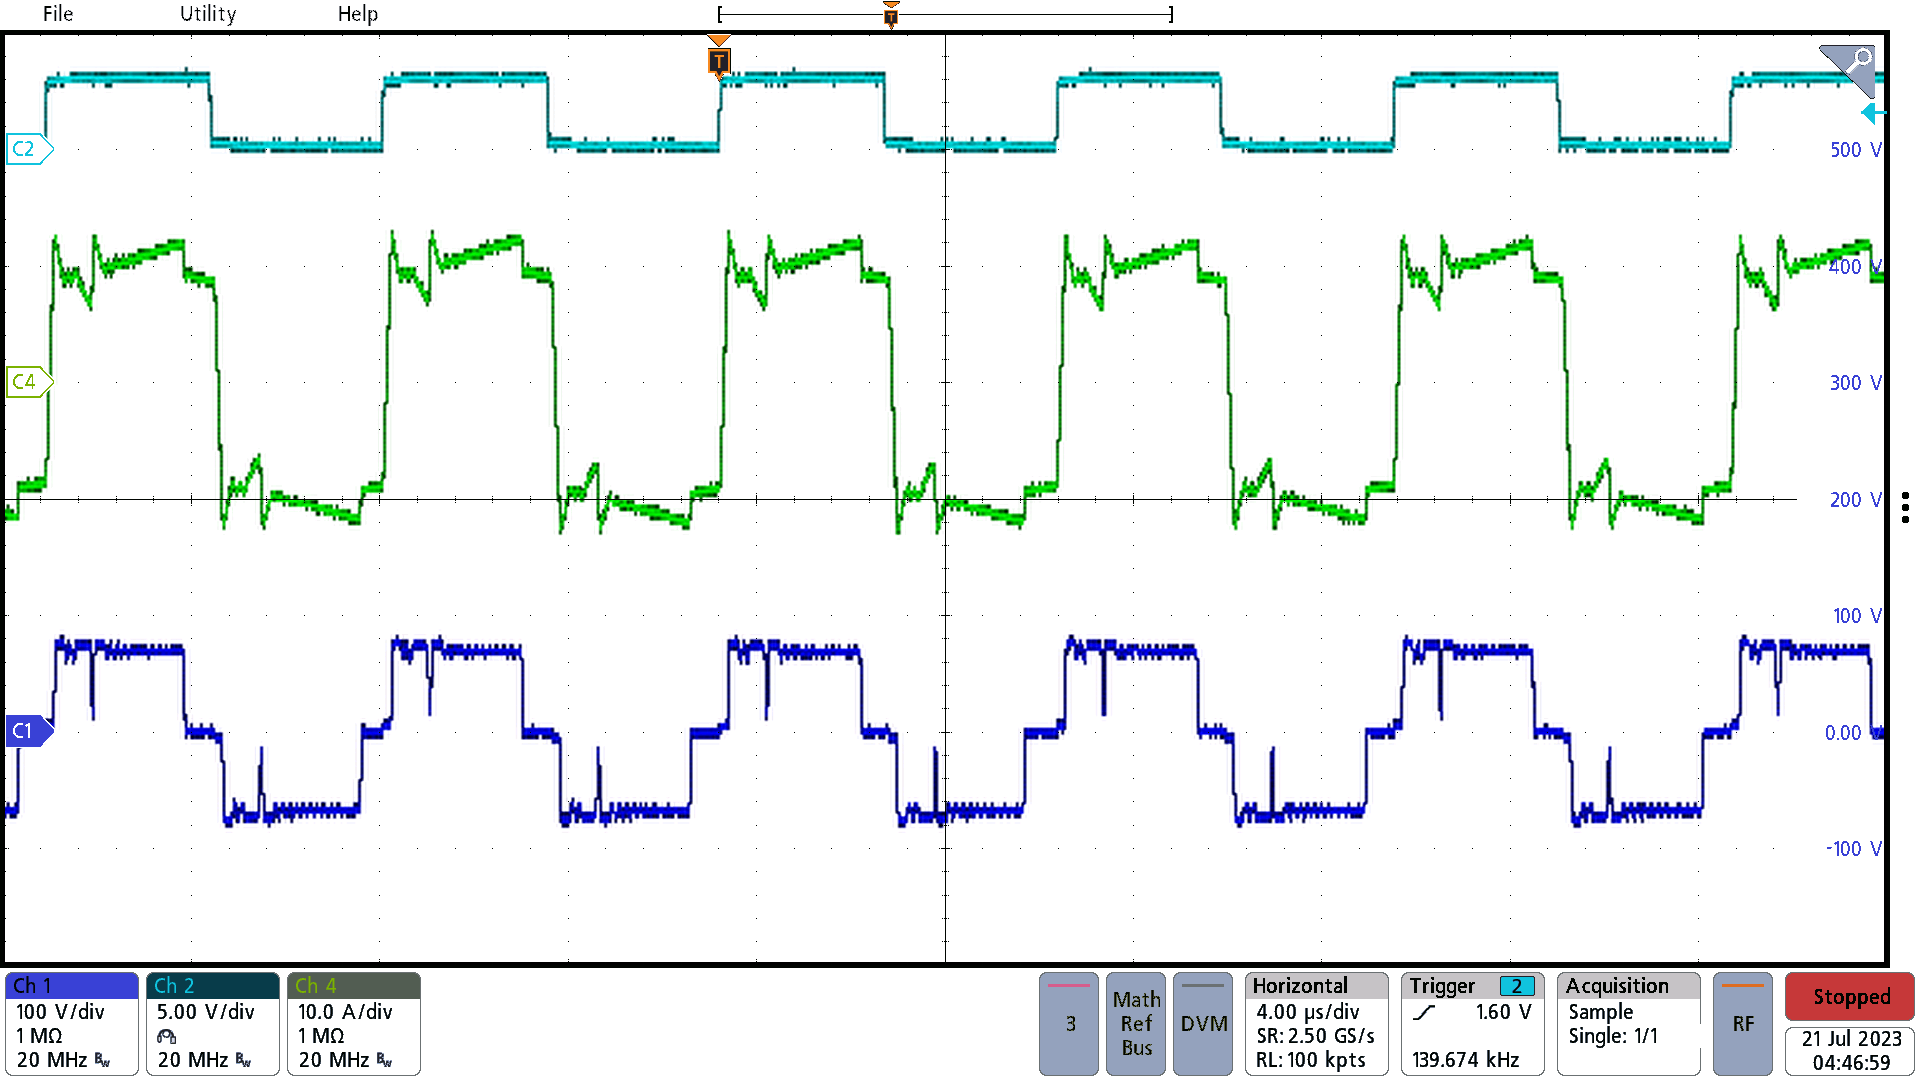 Figure 3-9 56-A Load