TIDT352 October 2023
2.4 Bode Plots
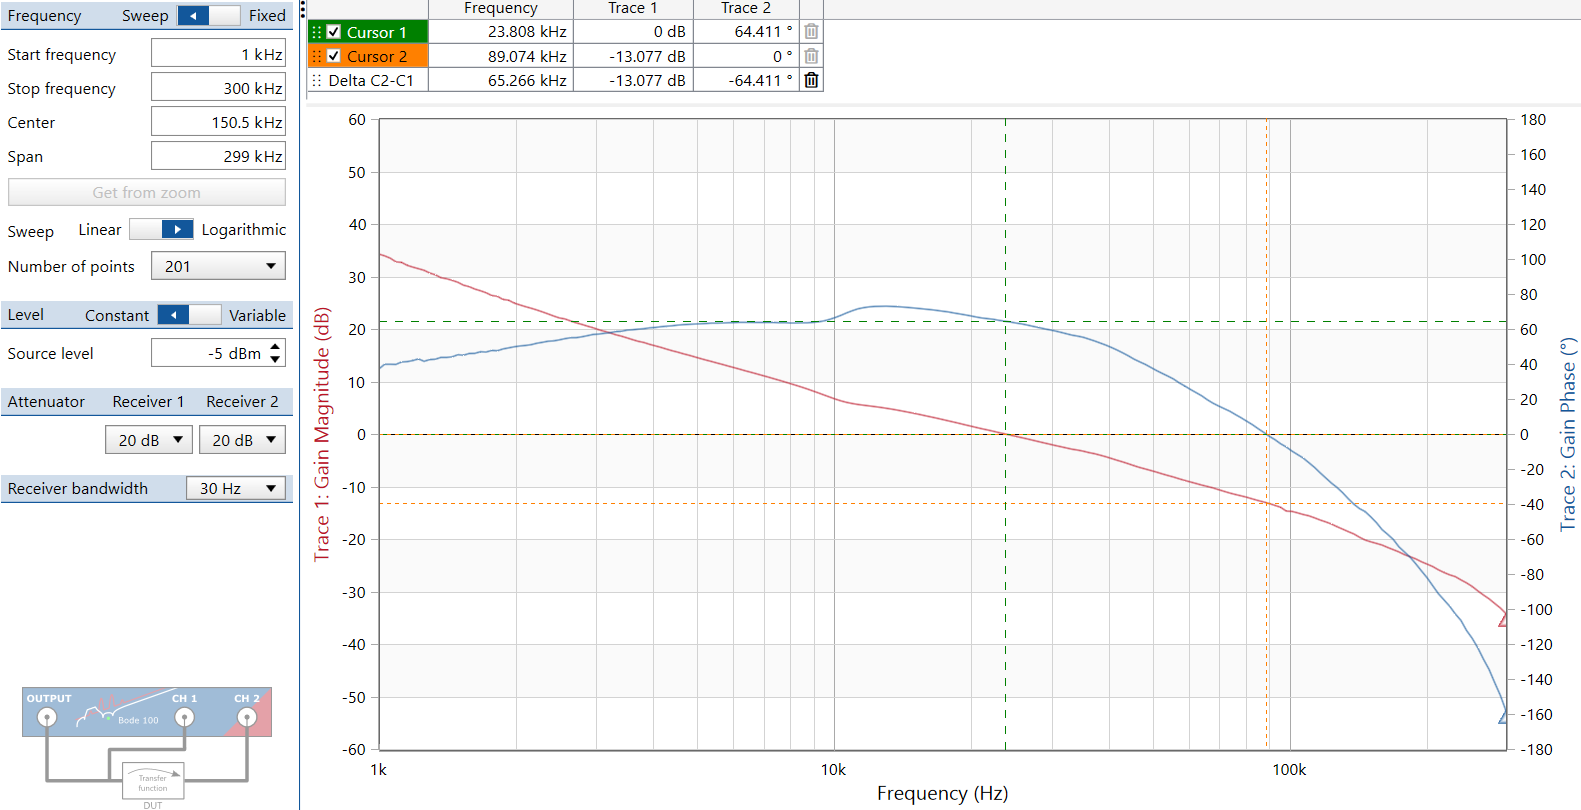
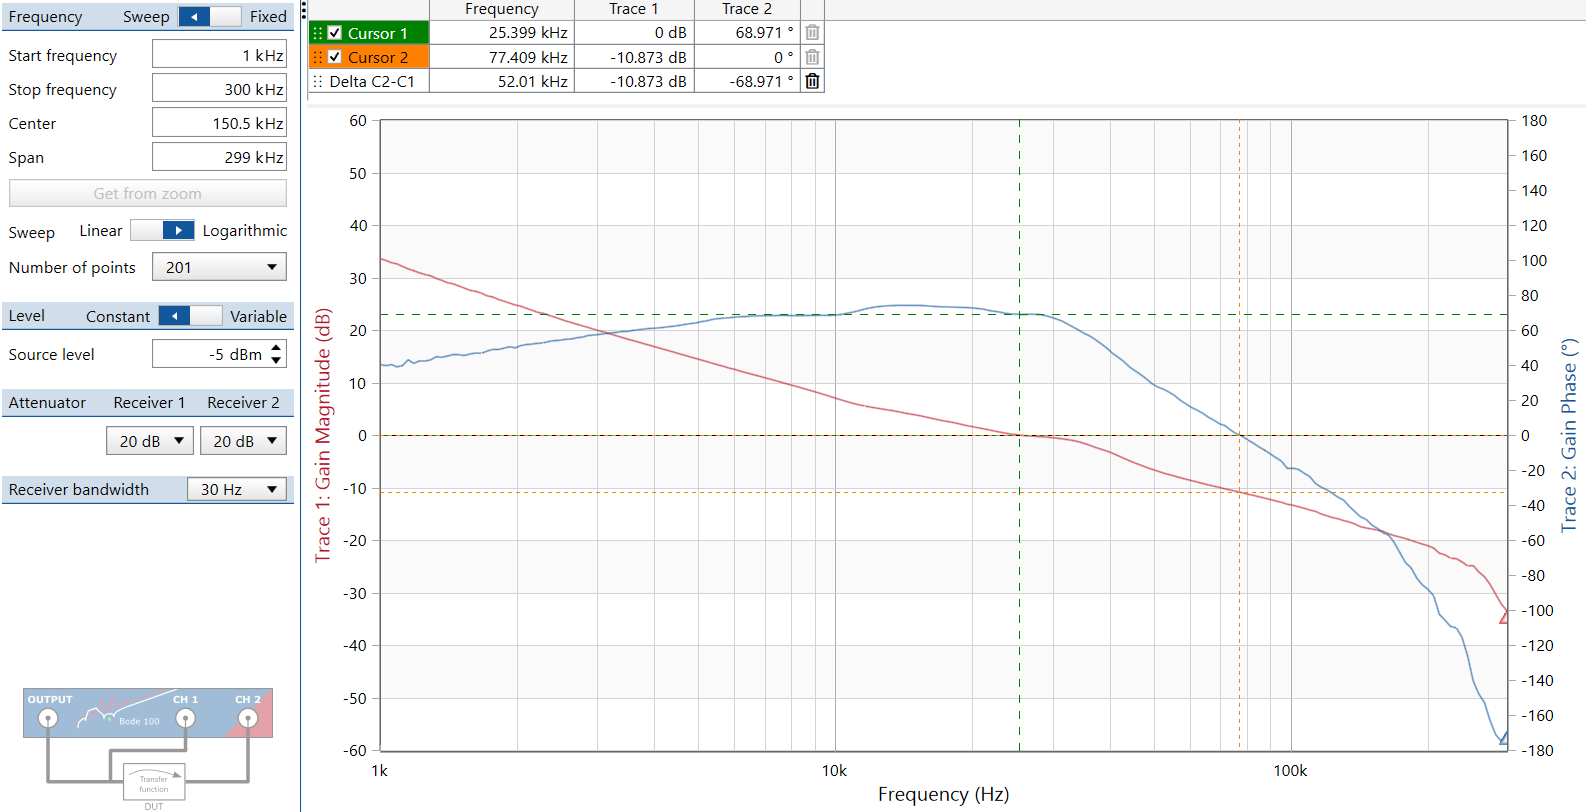
Each Bode plot is shown at a 5-V output. The Bode plots for different loads exhibit similar results, with the main difference being the slight appearance of noise. Thus, one Bode plot is shown for each input voltage.
Crossover increases with load from 23 kHz at no load to 28 kHz at the maximum 60-A load, but the phase margin is always at least 62 degrees and gain margin is more than 10 dB.
The Bode plots in Figure 3-15 and Figure 2-10 were created at a 30-A load with Figure 3-15 having a 24-V input and Figure 2-10 having a 48-V input.
 Figure 2-9 24-VIN Bode Plot
 Figure 2-10 48-VIN Bode Plot