TIDT355 October 2023
2.3 Thermal Images
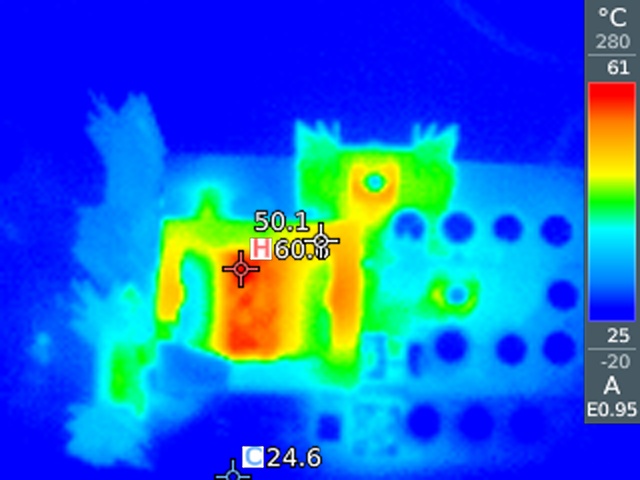
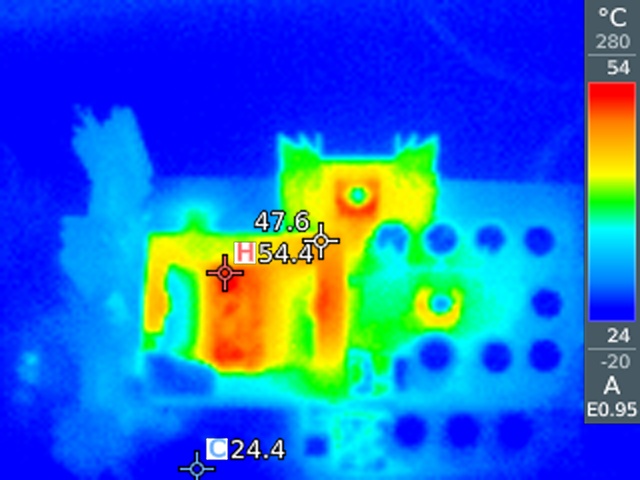
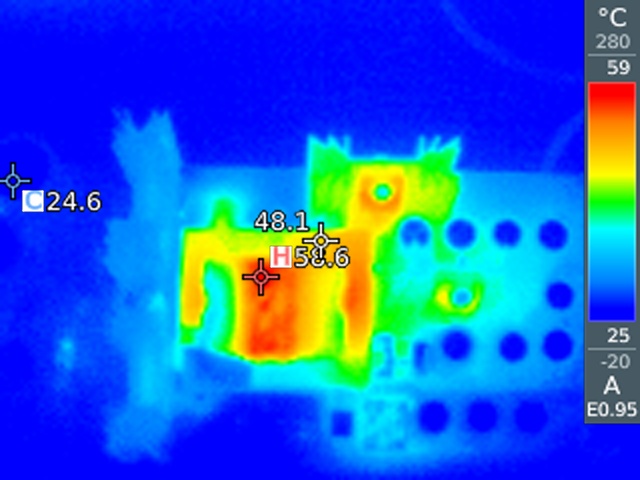
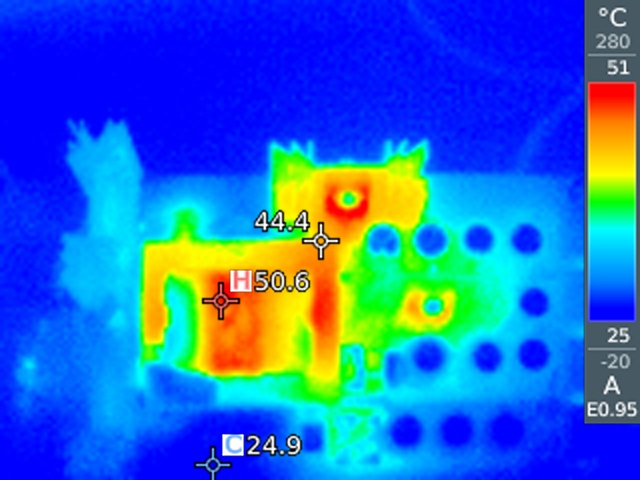
Table 2-2 shows the thermal images at the four voltages. All images were captured with 25ºC ambient, after a 30-minute warm up and with an airflow of 200 LFM.
Table 2-2 Thermal Image Data
| Temperature (°C) | ||||
|---|---|---|---|---|
| 600 VIN | 800 VIN | 1000 VIN | 1500 VIN | |
| High-side switch Q1 | 46.3 | 47.3 | 49.4 | 55.4 |
| Low-side switch Q2 | 42.4 | 43.5 | 43.2 | 47.3 |
| Transformer | 52.2 winding 52.4 Core | 55.2 winding 54.3 core | 59.2 winding 55.2 Core | 62.3 winding, 58.2 Core |
| Secondary diode (24 V) | 50.5 | 52.1 | 53.1 | 55.2 |
| Secondary diode (15 V) | 47.2 | 48.5 | 49.3 | 53.2 |
| Secondary diode (–15 V) | 41.4 | 42.3 | 44.6 | 45.6 |
| Secondary diode (8 V) | 46.2 | 47.2 | 48.5 | 50.3 |
| UCC28740 | 34.5. | 36.1 | 39.2 | 41.2 |
 Figure 2-2 Thermal Image at 1500
VIN Full Load
 Figure 2-4 Thermal Image at 800 VIN Full Load
 Figure 2-3 Thermal Image at 1000
VIN Full Load
 Figure 2-5 Thermal Image at 600
VIN Full Load