TIDT360
November 2023
1
Description
Features
Applications
1
Test Prerequisites
1.1
Voltage and Current Requirements
1.2
Required Equipment
1.3
Considerations
1.4
Dimensions
2
Testing and Results
2.1
Efficiency Graphs
2.2
Efficiency Data
2.3
Thermal Images
2.4
Bode Plots
3
Waveforms
3.1
Switching
3.2
Output Voltage Ripple
3.3
Load Transients
2.4
Bode Plots
The bode plot is shown in the following figure.
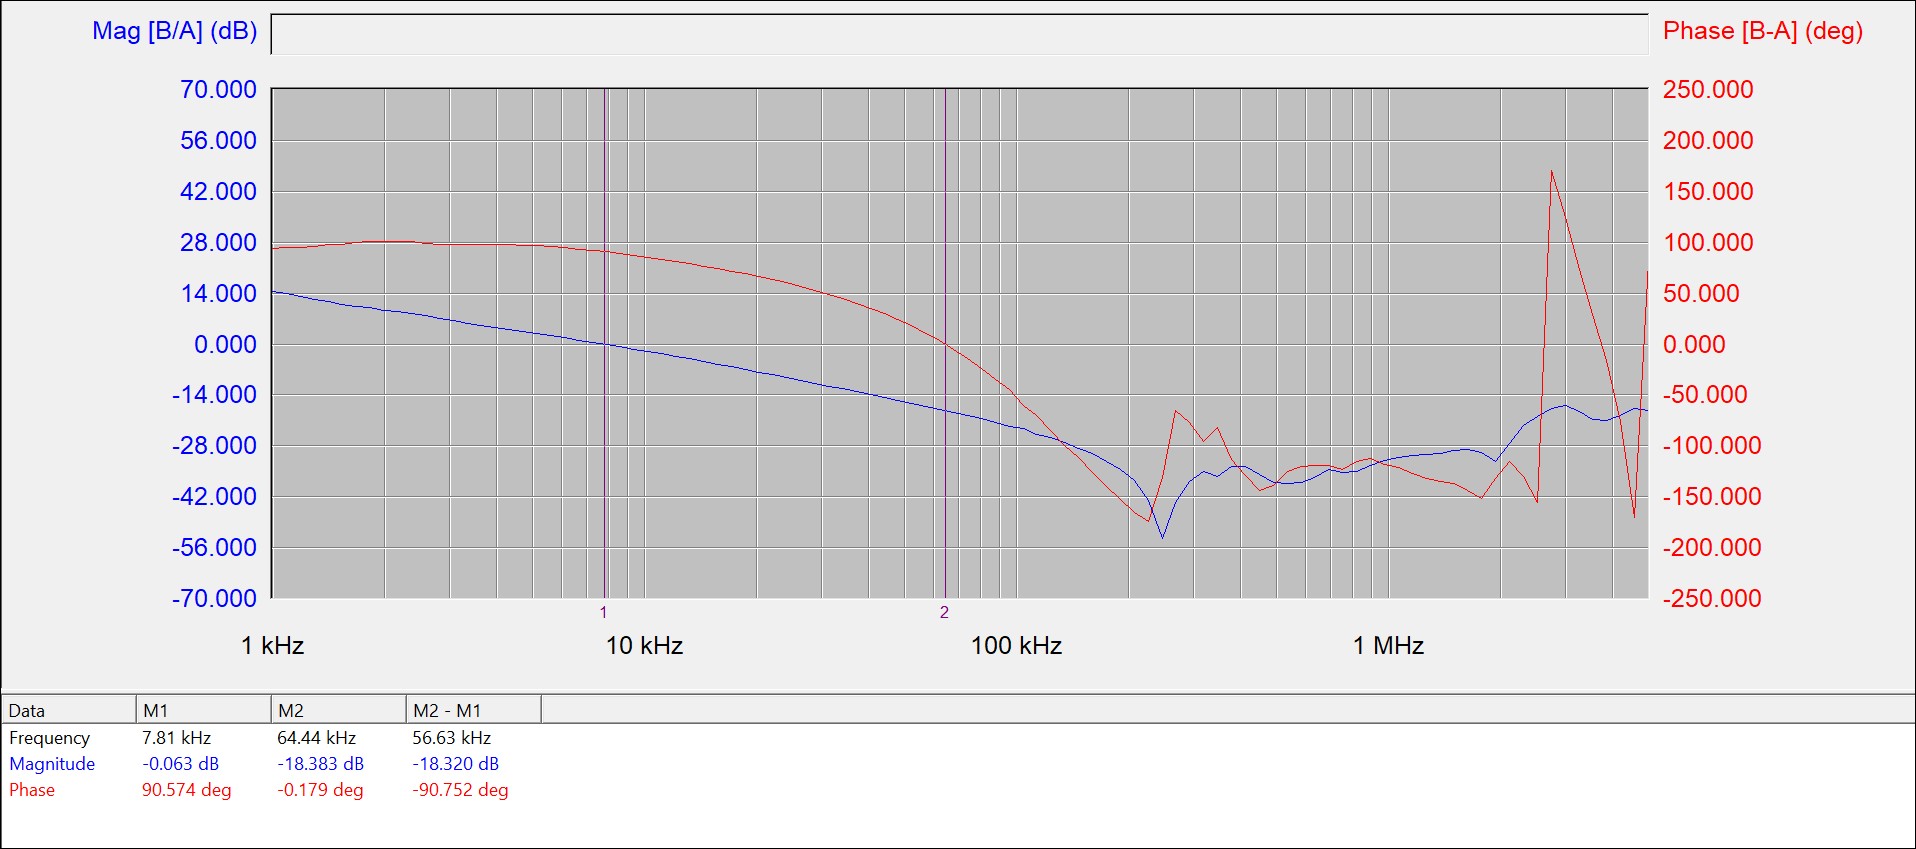
Gain Margin (GM) = 18.32 dB; Phase Margin (PM) = 90.75ĚŠ ; Crossover Frequency (f
c
) = 7.81 kHz
Figure 2-3
Bode Plot of the Main Boost Stage at Full Load, I
load
= 10 A, V
IN
= 12 V, V
OUT
= 45 V