TIDT368 August 2024
2.4 Thermal Images
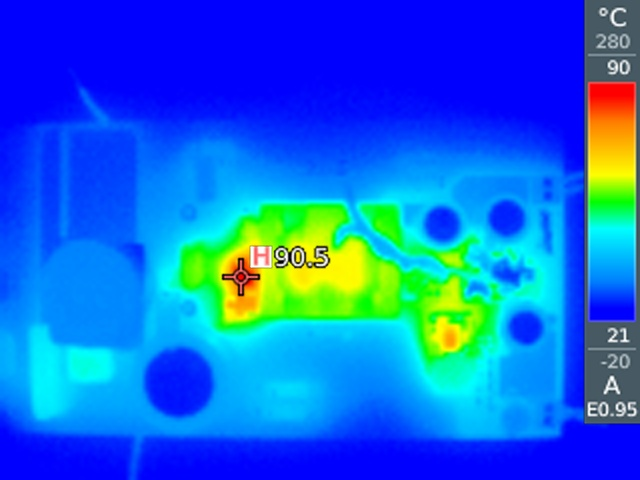
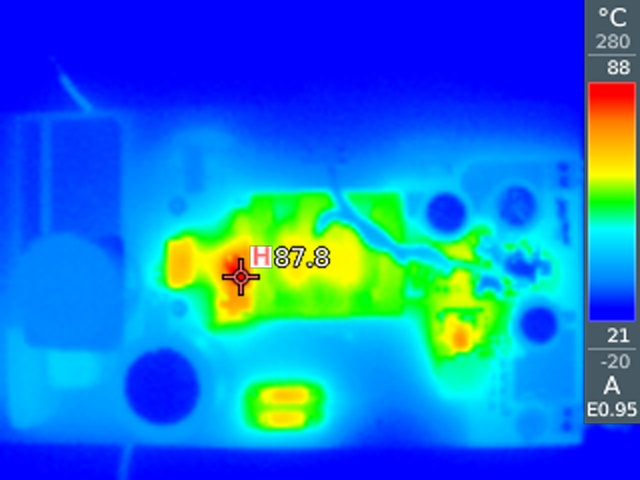
Table 2-5 shows the temperature data with 25ºC ambient after a 30-minute warm up.
Table 2-5 Temperature Data
| TEMPERATURE (°C) | TEST CONDITION FULL LOAD | |
|---|---|---|
| 115VAC | 230VAC | |
| Primary switch | 90.5 | 87.8 |
| Secondary diode | 59 | 60 |
| Transformer | 62.2 | 60.3 |
| Bridge | 50 | 49 |
| UCC28740 | 36 | 36 |
| LMR33620ADDAR | 76 | 75 |
Figure 2-4 and Figure 2-5 show the thermal images, all images were captured with 25ºC ambient, after a 30-minute warm up.
 Figure 2-4 Thermal Image at 115VAC,
Full Load
 Figure 2-5 Thermal Image at 230VAC,
Full Load