TIDT374 March   2024


  1.   1
  2.   Description
  3.   Features
  4.   Applications
  5. 1Test Prerequisites
    1. 1.1 Voltage and Current Requirements
    2. 1.2 Dimensions
  6. 2Testing and Results
    1. 2.1 Efficiency Graphs
    2. 2.2 Thermal Images
      1.      Top Side, 150VAC Input Voltage
      2.      Bottom Side, 150VAC Input Voltage
      3.      Top Side, 254VAC Input Voltage
    3. 2.3 Bode Plot
    4. 2.4 Electromagnetic Interference (EMI) Measurement
  7. 3Waveforms
    1. 3.1 Switching
      1. 3.1.1 150VAC Input Voltage
      2. 3.1.2 254VAC Input Voltage
    2. 3.2 Output Voltage Ripple
      1. 3.2.1 Output 1 (8V)
      2. 3.2.2 Output 2 (18V)
      3. 3.2.3 Output 3 (24V)
    3. 3.3 Input Voltage Ripple
    4. 3.4 Load Transient Output 3 (24V)
    5. 3.5 Start-Up
      1. 3.5.1 150VAC Input Voltage
      2. 3.5.2 253VAC Input Voltage
    6. 3.6 Shutdown
      1. 3.6.1 150VAC Input Voltage
      2. 3.6.2 253VAC Input Voltage

Bode Plot

The Bode plot is shown in the following figure.
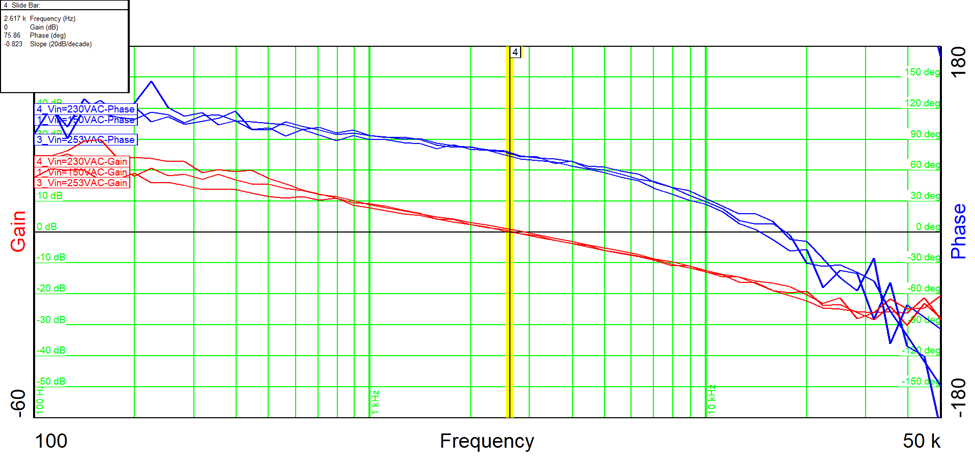
GUID-20240112-SS0I-0RCL-WLFX-SXL1W2K7QTQG-low.png Figure 2-6 Bode Plot
Input Voltage = 150VAC
Load = full load
Bandwidth = 2.9kHz
Phase Margin = 71°
Input Voltage = 230VAC
Load = full load
Bandwidth = 2.6kHz
Phase Margin = 76°
Input Voltage = 253VAC
Load = full load
Bandwidth = 2.7kHz
Phase Margin = 76°