TIDT391 April 2024
2.3 Thermal Images
Table 2-3 shows the thermal images at full power charge. All images were captured with 25ºC ambient, after a 30-minute warm up.
Table 2-3
| Temperature(°C) | Test Condition | ||||
|---|---|---|---|---|---|
| 5VIN to 30V Battery Charge | 9VIN to 30V Battery Charge | 15VIN to 30V Battery Charge | 20VIN to 30V Battery Charge | Short Circuit Test Temperature Rise at 20VIN | |
|
Q2 (Buck High side MOS) |
58.1 |
69.2 |
66.2 |
60.2 |
51.5 |
| Q4 (Buck Low side MOS) |
56.2 |
66.3 |
64.2 |
58.3 |
54.5 |
| Q1 (Boost High side MOS) |
65.2 |
75.3 |
72.7 |
66.2 |
42.4 |
| Q3 (Boost Low side MOS) |
77.2 |
83.4 |
78.3 |
73.4 |
42.3 |
| Buck Boost Inductor |
55.4 |
66.2 |
69.2 |
58.3 |
44.6 |
| TPS25730D |
40.2 |
45.2 |
47.5 |
46.1 |
42.1 |
| BQ25756E |
45.2 |
51.2 |
56.2 |
57.3 |
45.6 |
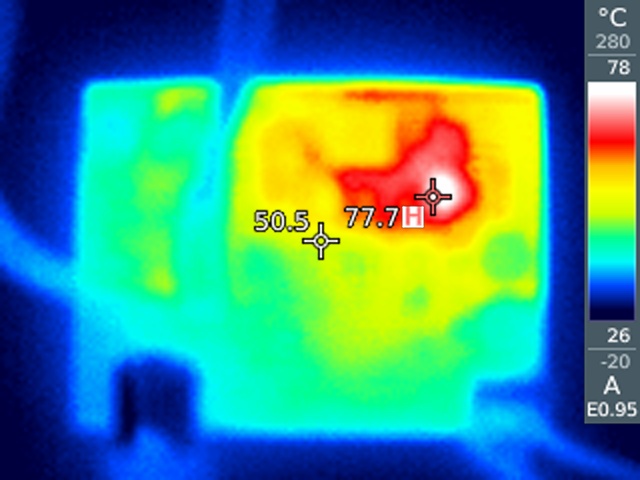 Figure 2-4 5VIN to 30V
Battery Charge Thermal
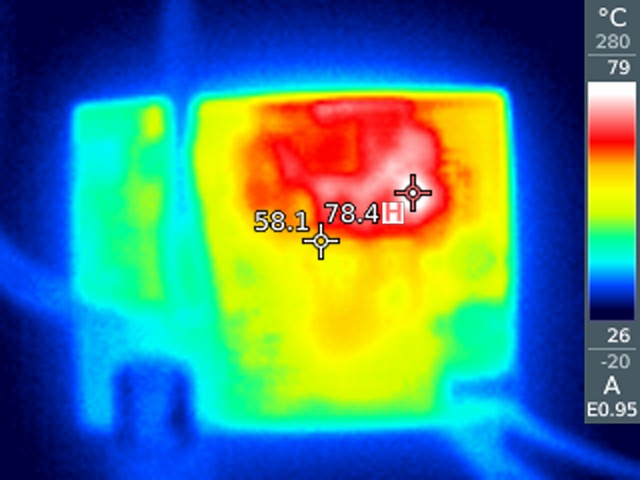 Figure 2-6 15VIN to 30V
Battery Charge Thermal
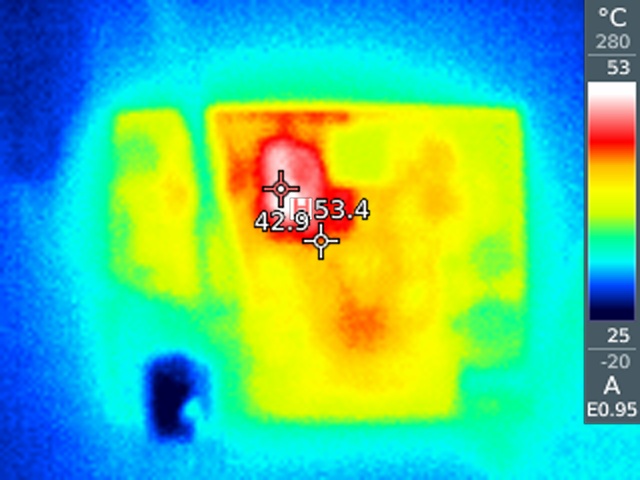 Figure 2-8 20VIN to 30V
Battery Short Circuit Thermal Test
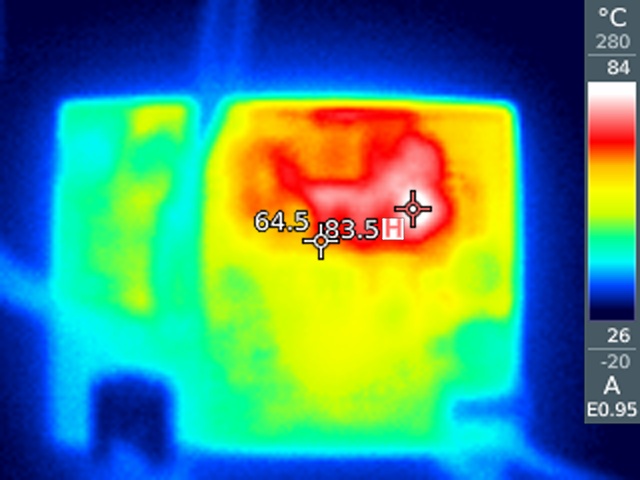 Figure 2-5 9VIN to 30V
Battery Charge Thermal
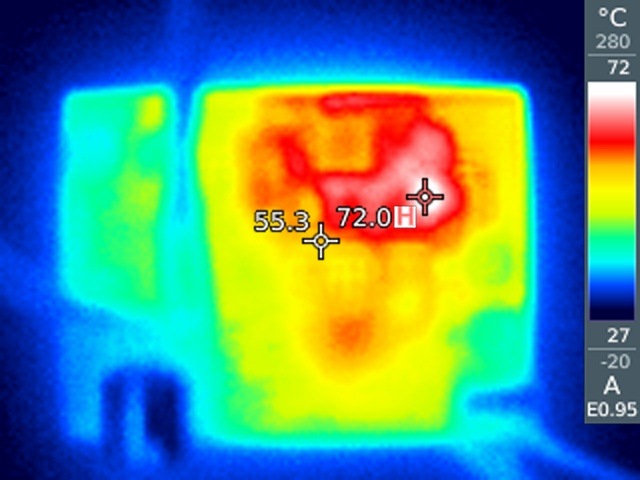 Figure 2-7 20VIN to 30V
Battery Charge Thermal