TIDT407 October 2024
2.1 Efficiency Graphs
The following figure show the charge mode efficiency across different input voltage conditions at 12S battery. Figure 2-1 and Figure 2-2 show the efficiency at OTG (reverse power) mode, output current is set to 3A for 5V, 9V, 15V input source, and 5A for 20V, 28V, 48V input source.
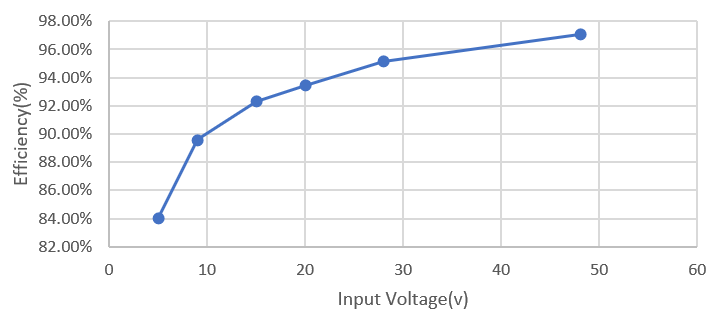 Figure 2-1 Charge Mode Efficiency Across Input
Voltage
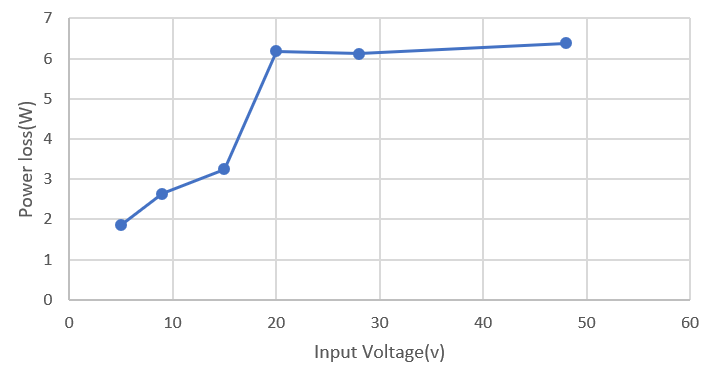 Figure 2-2 Power Loss Across Input Voltage
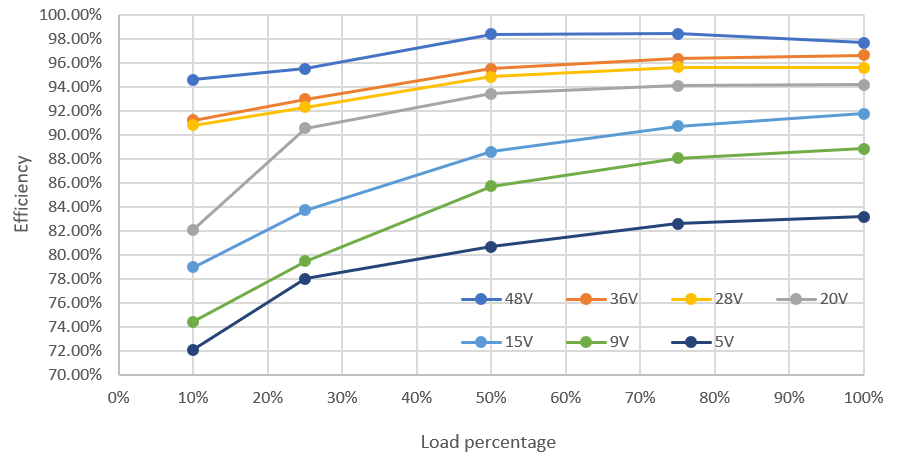 Figure 2-3 OTG Mode Efficiency at 12S Battery Across
Vout and Load
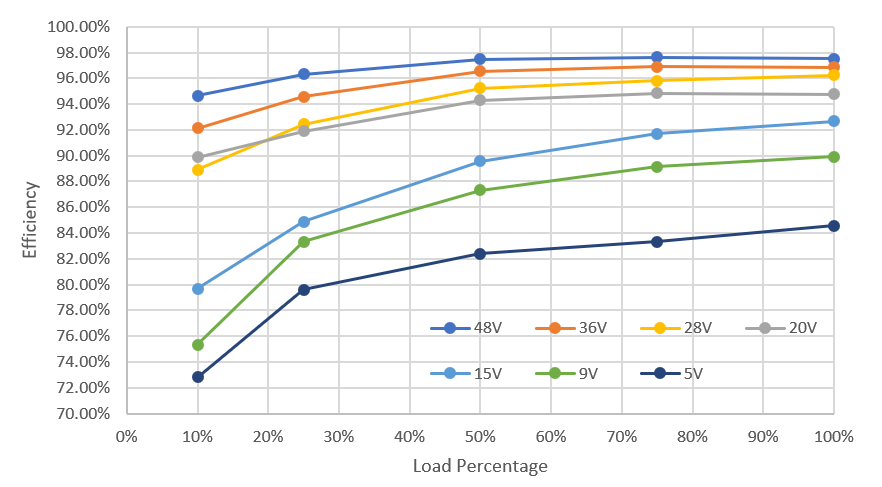 Figure 2-4 OTG Mode Efficiency at 10S Battery Across
Vout and Load
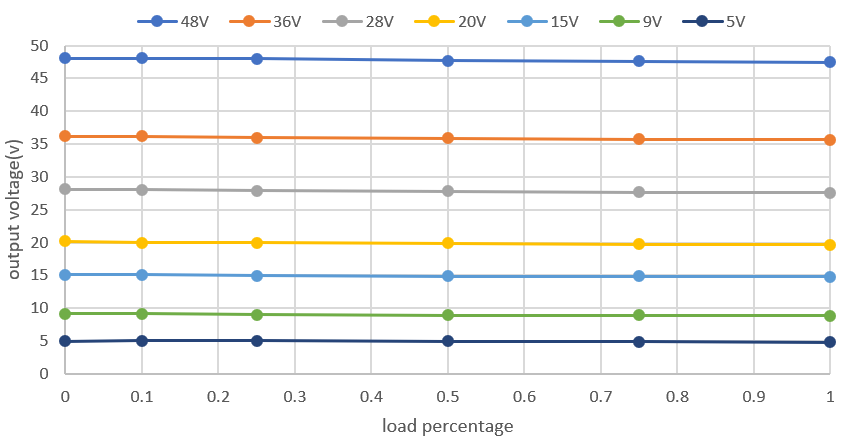 Figure 2-5 Vout Regulation at 12S Battery
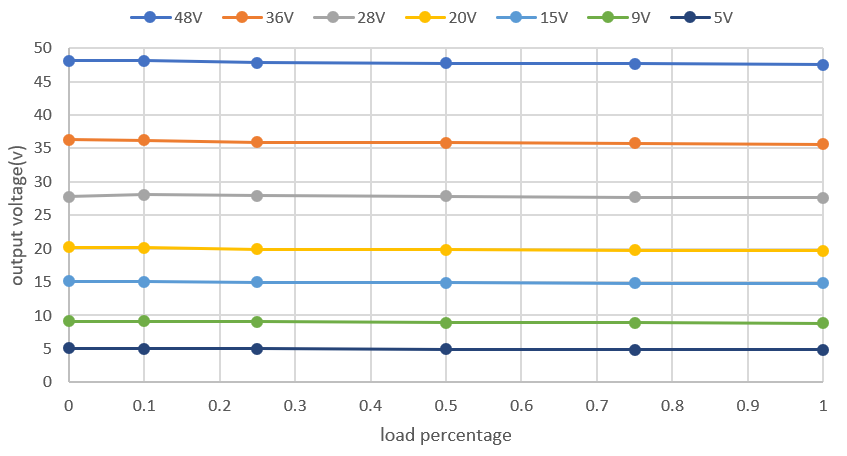 Figure 2-6 Vout Regulation at 10S
Battery