TIDT411 September 2024
2.4 Thermal Images
Thermal image is shown in Table 2-2.
Table 2-2 Component Temperature, 230V,
50Hz Input, Full Load
| LLC Inductor | 52℃ |
| LLC Transformer | 55℃ |
| LLC Rectifier Diodes | 51.3℃ |
| Rectifier Bridge | 50℃ |
| PFC Choke | 36℃ |
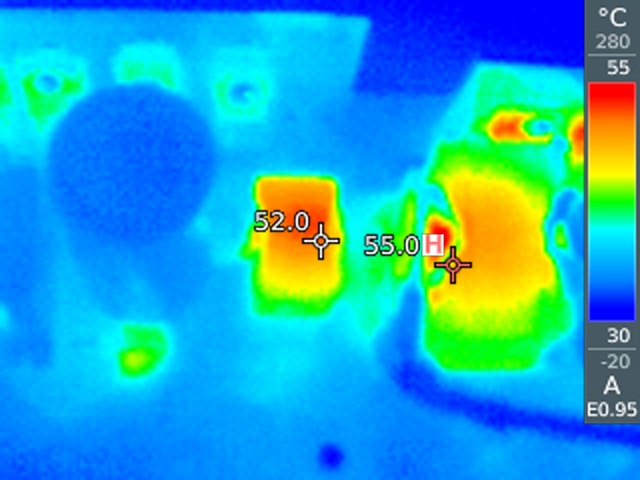 Figure 2-6 Thermal Image at 230Vac
Note: TA = 25.0°C, 230V, 50Hz Input, Full Load
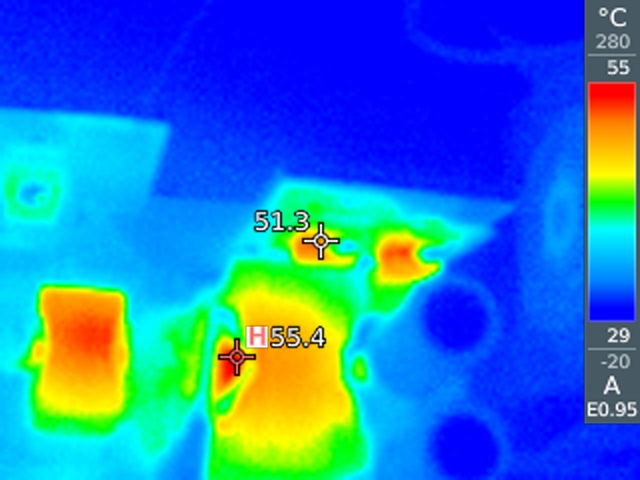 Figure 2-7 Thermal Image at 230Vac
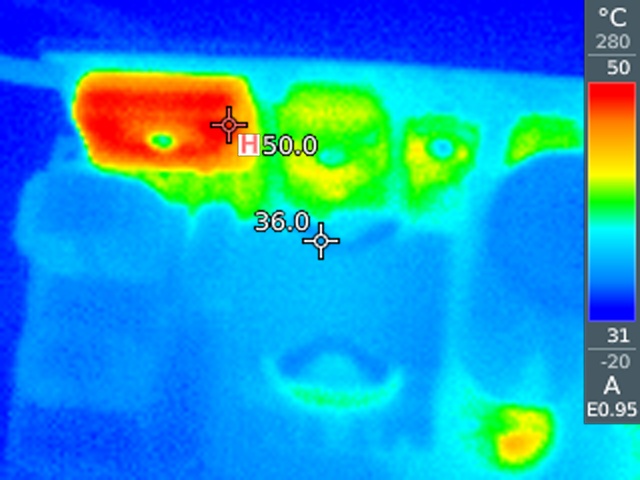 Figure 2-8 Thermal Image at 230Vac
Table 2-3 Component Temperature, 110V, 50Hz Input, Full Load
| LLC Inductor | 52.6℃ |
| LLC Transformer | 55.4℃ |
| LLC Rectifier Diodes | 51.3℃ |
| Rectifier Bridge | 67.9℃ |
| PFC MOSFET | 45.9℃ |
 Figure 2-9 Thermal Image at 110Vac
Note: TA = 25.0°C, 110V, 50Hz Input, Full Load
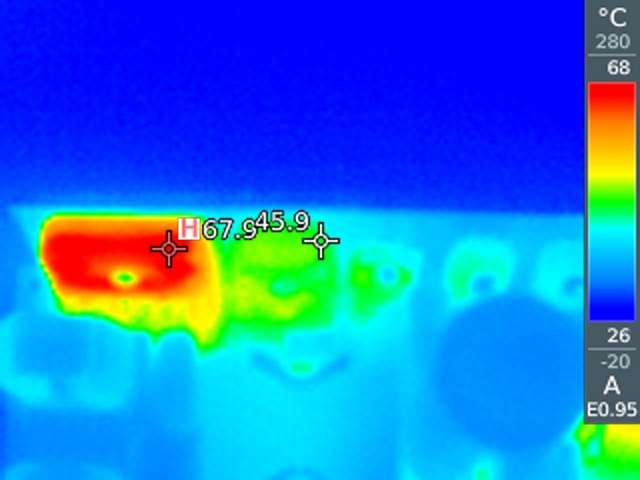 Figure 2-10 Thermal Image at 110Vac
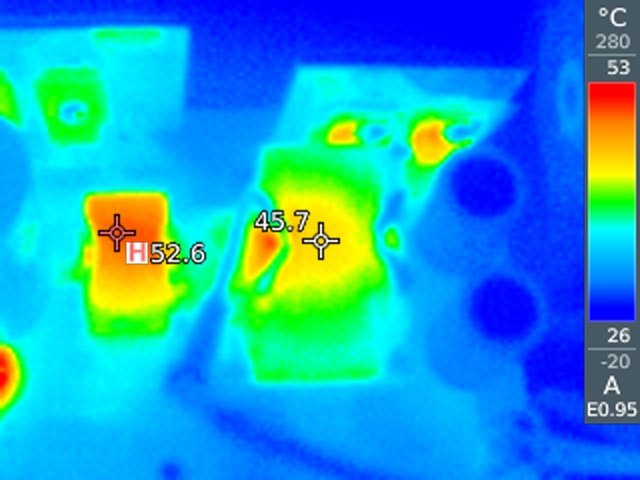 Figure 2-11 Thermal Image at 110Vac
Note: Tested after 30 minutes operation, with 12V, 0.5A fan cooling