TIDT426 December 2024
2.3 Thermal Images
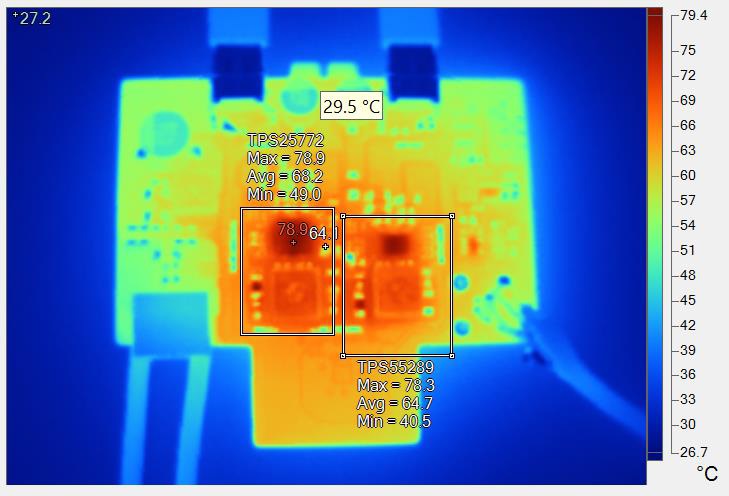
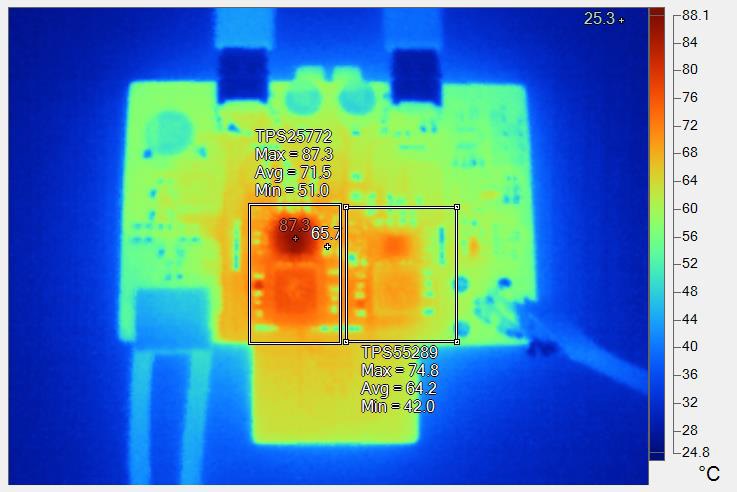
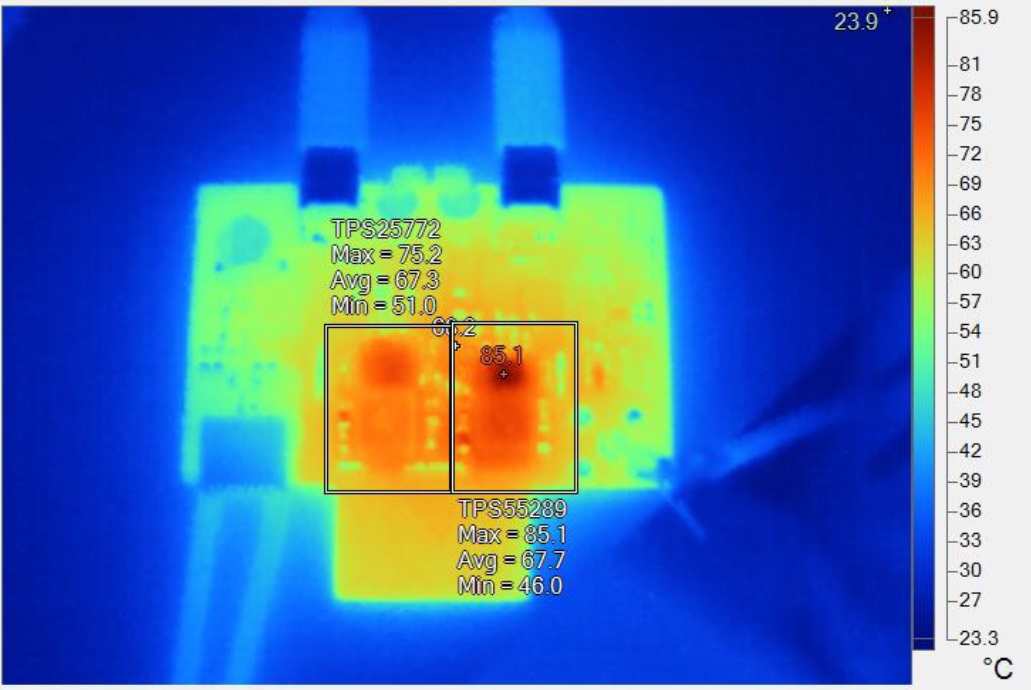
The thermal images are shown in Figure 2-2 through Figure 2-4. The ambient temperature is 25°C, and the thermal images were taken with a 14V input. The controller was operated for approximately 30 minutes before thermal images were taken to verify the thermal steady state was reached.
The board copper of the top and bottom layers is 2oz, and the copper of the middle layers is 1oz.
 Figure 2-2 Top Side Thermal Image, VPA_BUS = VPB_BUS = 20V, IPA_BUS = IPB_BUS = 2.25A
 Figure 2-3 Top Side Thermal Image, VPA_BUS = VPB_BUS = 20V, IPA_BUS = 3A, IPB_BUS = 1.5A
 Figure 2-4 Top
Side Thermal Image, VPA_BUS =
VPB_BUS = 20V, IPA_BUS =
1.5A, IPB_BUS = 3A