TIDUA71A January 2022 – November 2024
3.2.2 Thermal Performance
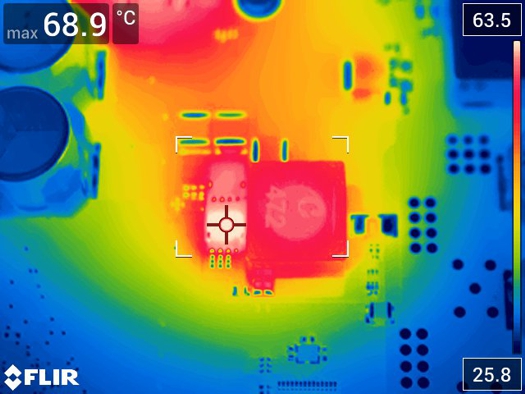
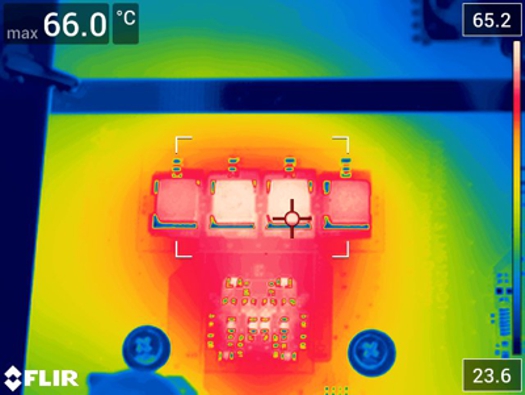
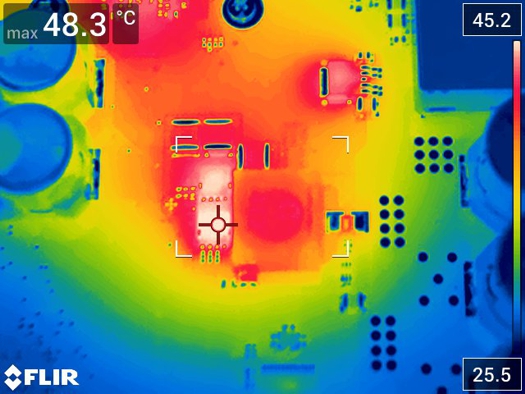
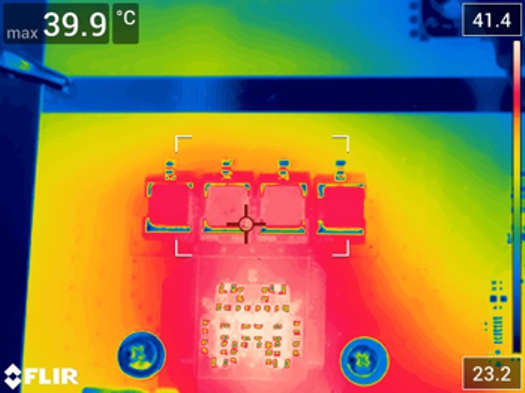
Figure 3-3 through Figure 3-6 are thermal images that demonstrate the improvement in efficiency of the system when running the system with Class-H. This was tested with a simple 1-kHz sine wave that would vary between full power for 100 ms and one-eighth of full power for 900 ms repeatedly. The system was allowed to reach a stable temperature before capturing with a thermal camera. When examining the system thermally, there are key areas that show significant improvement:
- The low-side MOSFET of the boost
- The boost inductor
- Output filter inductors of the Class-D amplifier
Class-H operation allows these key areas to operate with lower average currents at lower voltages, significantly reducing thermal losses.
 Figure 3-3 Thermal Image of Boost
Powertrain With Class-H Disabled
 Figure 3-5 Thermal Image of Amplifier
Output Inductors With Class-H Disabled
 Figure 3-4 Thermal Image of Boost
Powertrain With Class-H Enabled
 Figure 3-6 Thermal Image of Amplifier
Output Inductors With Class-H Enabled