TIDUCL0 January 2017
- 1 Description
- 2 Resources
- 3 Features
- 4 Applications
- 5 Design Images
- 6 System Overview
-
7 System Design Theory
- 7.1 Power Stage Design—Battery Power Input to the Board
- 7.2 Power Stage Design—Three-Phase Inverter
- 7.3 Power Stage Design—DRV8323 Gate Driver
- 7.4 Power Stage Design—18-V to 3.3-V DC-DC Converter
- 7.5 Power Stage Design —Microcontroller MSP430
- 7.6 Power Stage Design—Hall Sensor Interface
- 7.7 Temperature Sensing
- 7.8 Power Stage Design—External Interface Options and Indications
- 8 Getting Started Hardware and Software
- 9 Testing and Results
- 10Design Files
- 11Software Files
- 12Related Documentation
- 13Terminology
- 14About the Author
9.2.2.1 Load Test Without Heat Sink
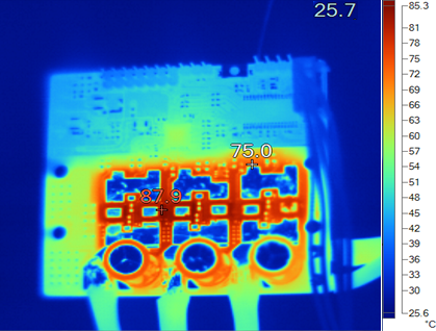
Figure 31 shows the motor winding current and winding voltage waveforms at a 18-V DC input and a 33-ARMS winding current. The result is tabulated in Table 5. The testing is done at 100% duty cycle. Figure 32 shows the steady state thermal image of the board at the same condition, captured after 10 minutes of continuous running. The maximum FET temperature observed is 87.9°C.
Table 5. Load Test Results at 100% Duty Cycle Without Heat Sink
| VDC (V) | IDC (A) | WINDING CURRENT (RMS) (A) | DUTY CYCLE | INPUT POWER (W) |
|---|---|---|---|---|
| 18 | 38 | 33 | 100% | 680 |
 Figure 31. Load Test Results at 18-V DC Input, 33-ARMS Winding Current, 100% Duty Cycle
  Figure 32. Thermal Image at 18-V DC Input, 33-ARMS Winding Current, 100% Duty Cycle
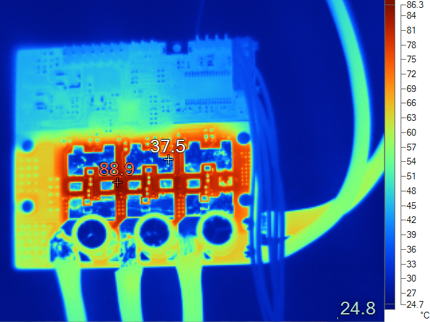
 Figure 33 shows the motor winding current and winding voltage waveforms at a 18-V DC input and a 31.8-ARMS winding current. The result is tabulated in Table 6. The testing is done at 90% duty cycle. Figure 34 shows the steady state thermal image of the board at the same condition, captured after 10 minutes of continuous running. The maximum FET temperature observed is 88.9°C.
Table 6. Load Test Results at 90% Duty Cycle Without Heat Sink
| VDC (V) | IDC (A) | WINDING CURRENT (RMS) (A) | DUTY CYCLE | INPUT POWER (W) |
|---|---|---|---|---|
| 18 | 33 | 31.8 | 90% | 594 |
 Figure 33. Load Test Results at 18-V DC Input, 31.8-ARMS Winding Current, 90% Duty Cycle
  Figure 34. Thermal Image at 18-V DC Input, 31.8-ARMS Winding Current, 90% Duty Cycle